%201.avif)

When To Buy Call Options vs Put Options: Complete Decision Framework for 2026
.png)
Taylor Drake
.png)
December 12,2025
.png)
15mins read
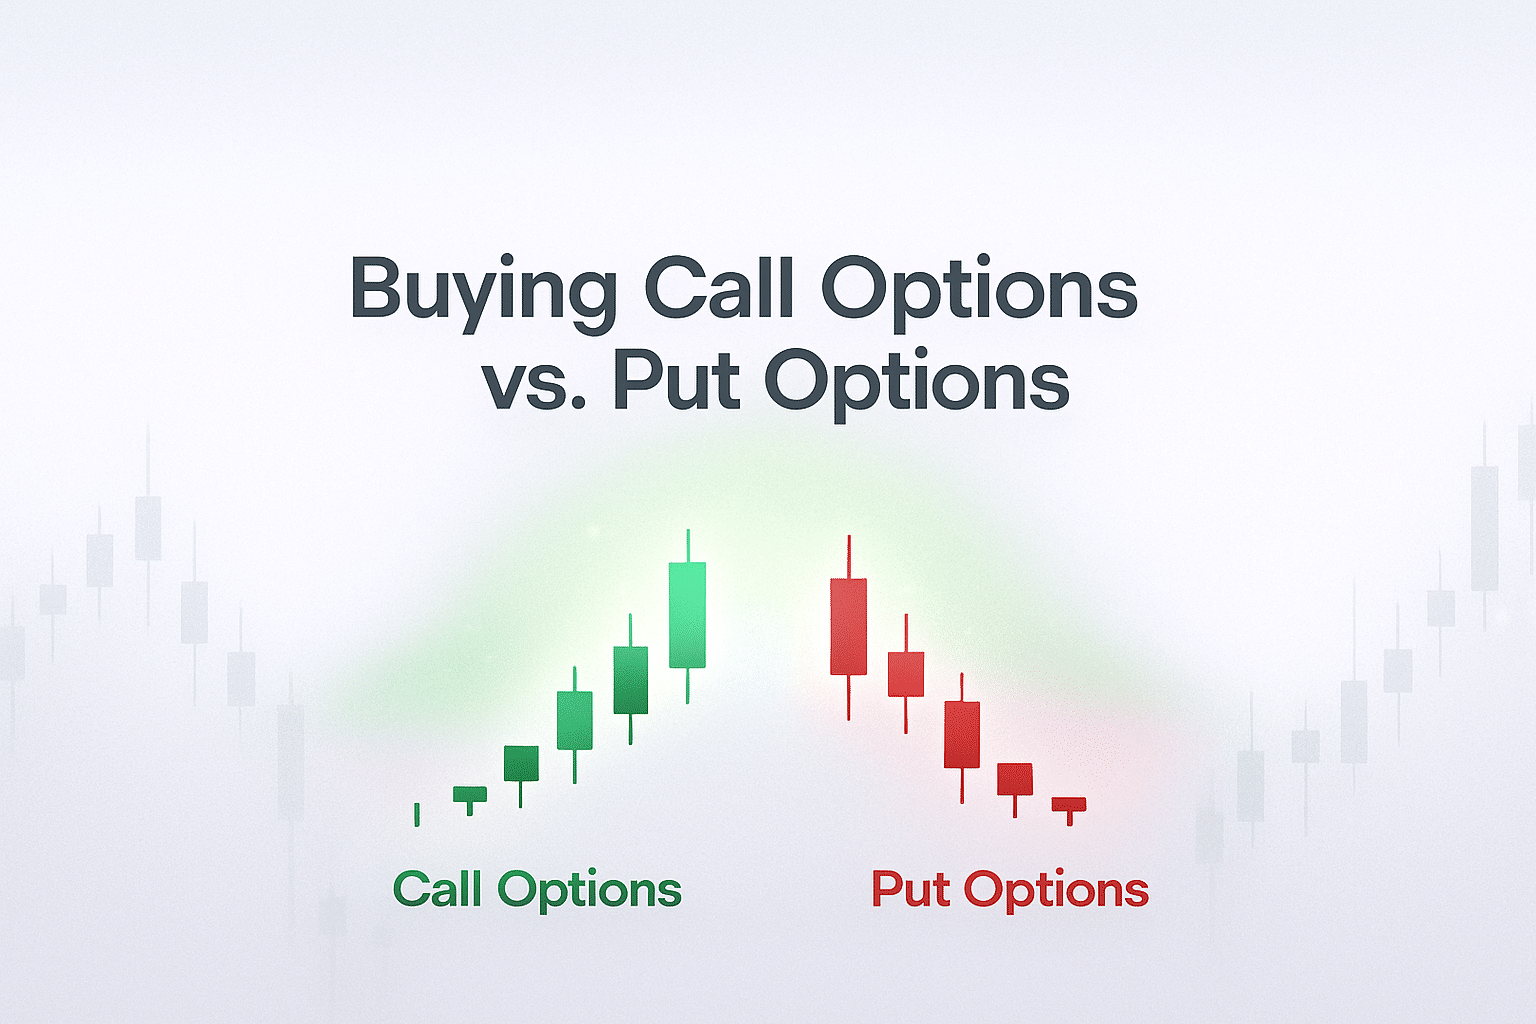
The decision between buying call options vs put options requires systematic analysis of four critical factors:
Rather than guessing market direction, successful options traders use GammaEdge’s systematic framework to assess market conditions, identify structurally aligned stocks, and time entries when multiple indicators confirm the same directional thesis.
You’re staring at your watchlist after market close.
AAPL looks technically strong with a perfect cup-and-handle pattern, but the broader market feels shaky with selling pressure building.
TSLA has a clear breakdown below key support, but you’re not sure if puts are the right play or where to target.
Sound familiar?
Most traders encounter this exact scenario daily – individual stocks showing compelling setups that contradict broader market conditions.
You know the basics:
But how do you systematically decide which direction has the highest probability of success?
Here’s the typical process:
Sometimes it does. Sometimes the broader market overwhelms your perfectly analyzed stock setup, and you watch your calls get crushed despite being “right” about the company.
Your AAPL calls don’t just compete against AAPL’s fundamentals and technicals – they’re fighting against the entire market’s structural forces.
Conversely, when market structure supports upward momentum, even mediocre stocks can deliver explosive call option gains.
When the broader market environment favors downward pressure, even the strongest individual stocks struggle to maintain sustained upward moves.
Conversely, when market structure supports upward momentum, even mediocre stocks can deliver explosive call option gains.
You learn what calls and puts are. You understand basic mechanics like time decay and implied volatility.
But you’re never taught how to systematically assess whether market conditions actually support your directional choice.
By the end of this article, you’ll have a complete framework that removes guesswork from the most critical decision in options trading:
Let’s dive in.
Here’s what happened with those TSLA puts you bought last week: The stock had a perfect technical breakdown, RSI was moving lower, and the chart looked textbook bearish. You bought puts expecting easy profits.
Instead, TSLA bounced 8% the next day while your puts lost 40% of their value.
What went wrong?
Most traders pick call and put options using this flawed process:
Step 1: Focus on Individual Stock Analysis
Step 2: Choose Strikes Based on Price
Step 3: Time Entries on Chart Patterns
This approach ignores the most critical factor in options success: the broader market environment that determines whether your individual stock analysis actually matters.
Here’s the truth most traders learn the hard way:
Individual stocks don’t trade in isolation. They’re influenced by massive structural forces that can overwhelm even the most compelling single-stock setups.
Consider this scenario:
But if the broader market is in a structurally bullish environment – with call speculation in the overall options market building, institutional money flowing into equities, and momentum building across multiple timeframes – your individual stock analysis becomes irrelevant.
The market’s structural forces will likely carry TSLA higher despite its technical weakness.
When you trade options without considering market environment:
Instead of gambling on individual stock moves, successful options traders use a systematic approach:
Step 1: Assess the overall market environment first
GammaEdge’s Solve: We’ve developed the Market Trend Model (based off the Tick Index), tracks momentum under the hood of the market across multiple time frames. Additionally, we analyze the SPX options market structure to get an in-depth understanding of if call or put speculators are in control. By combining these two methodologies, it provides us with a clear picture of the strength or weakness in the market overall.
Step 2: Align your directional bias with market structure
Step 3: Use data-driven scans to find structurally aligned stocks
GammaEdge’s Solve: We’ve developed proprietary scans that incorporate the options market to help us identify those stocks which support our directional thesis. So if you’re bullish, we have scans that look for call-dominated stocks. And if you’re bearish, then we have scans that look for put-dominated stocks.
Step 4: Time entries using structural validation
GammaEdge’s Solve: We’ve developed critical levels based on our analysis of options market structure and how speculators are positioned. These levels include our transition zones, which help us identify where choppy price action is likely to occur as well as where we should be getting long or short based on a breakout (or breakdown) through that zone. From there, we look to see where upside and downside speculator positioning is concentrated for key upside/downside profit target levels.
This systematic approach transforms options trading from speculation into strategic positioning with market forces working in your favor rather than against you.
Most traders approach options direction like this: “This stock looks bullish, so I’ll buy calls.” Or “Bad earnings are coming, so I’ll buy puts.”
That’s backwards.
The GammaEdge Framework starts with the big picture and narrows down to specific opportunities. Instead of hoping your individual stock analysis overcomes hostile market conditions, you align your trades with the dominant structural forces from day one.
Here’s our complete systematic framework:
Step 1: Assess Overall Market Environment
Step 2: Determine Your Directional Bias
Step 3: Identify Structurally Aligned Stocks
Step 4: Validate Entry Timing
The key insight is that you’re not fighting against market structure – you’re positioning when multiple layers of analysis confirm the same directional bias.
Before making any directional decisions, you need to understand what the broader market is actually doing. Not what the headlines say. Not what the talking heads predict. But rather, what the actual money flows and positioning data reveal about market structure.
The Market Trend Model gives you real-time insight into buying and selling pressure across multiple timeframes. Think of it as your market momentum dashboard.
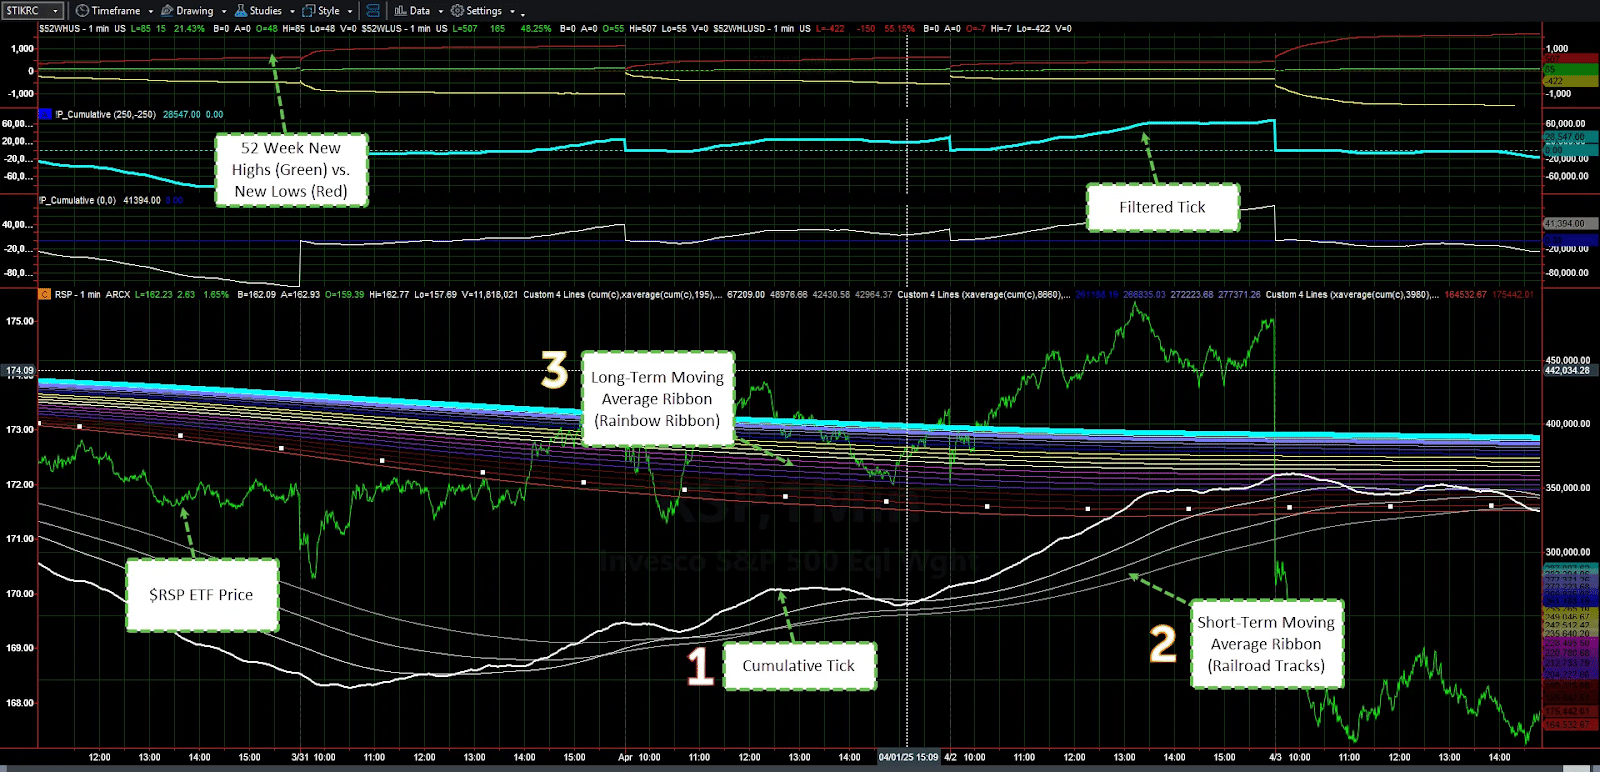
What to Look For:
(1) Cumulative Tick (Real-Time Momentum)
*Timeframe: Intraday
(2) Railroad Tracks (Short-Term Trend)
Timeframe: 1-3 days
(3) Rainbow Ribbon (Longer-Term Context)
Timeframe: 1-3 weeks
Filtered Tick (Institutional Participation)
*Timeframe: Intraday
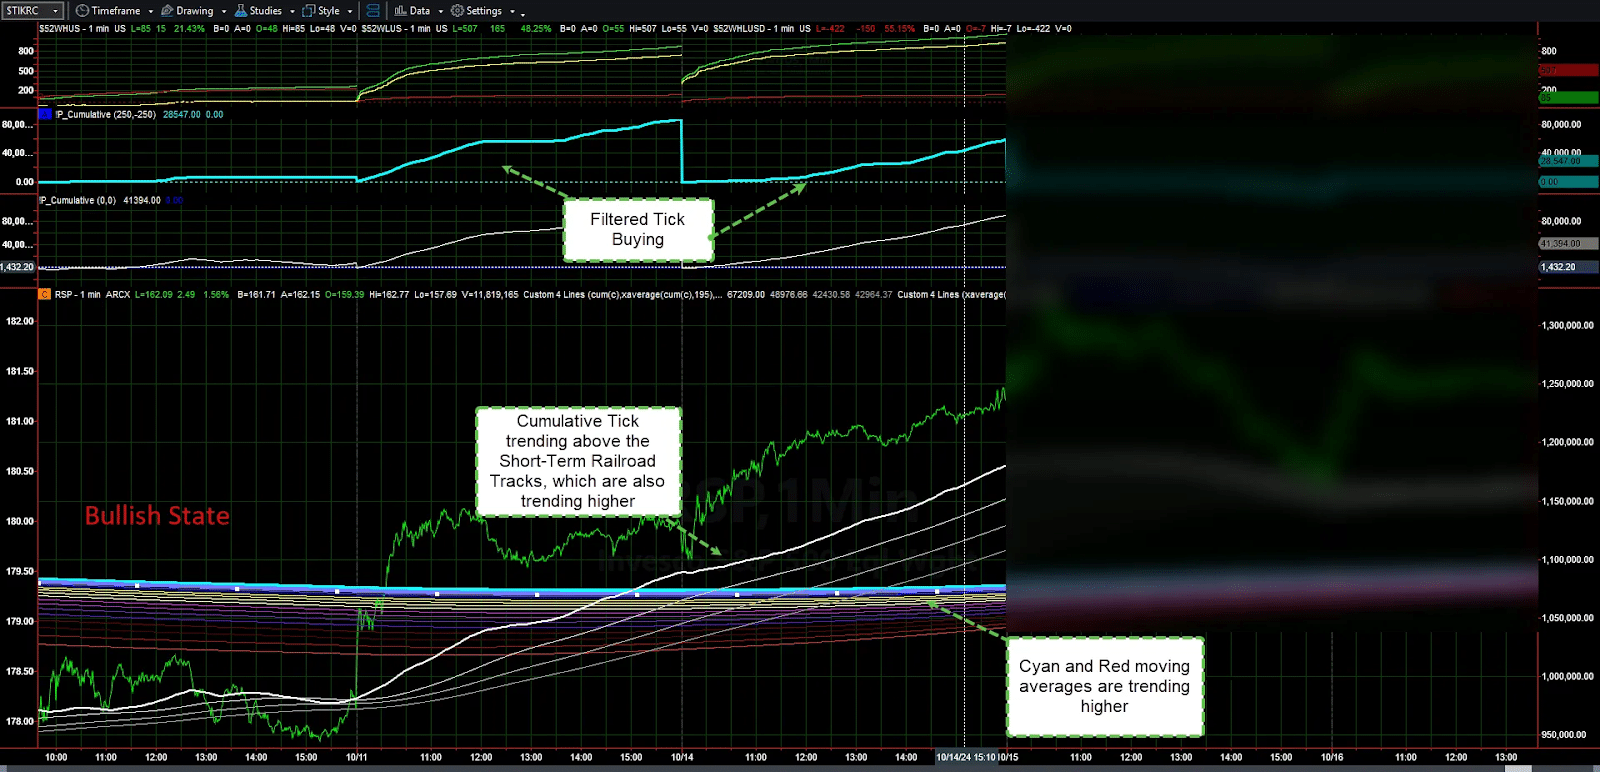
And so you have it for your reference, here is an example of a Market Trend Model that is bullish in nature:
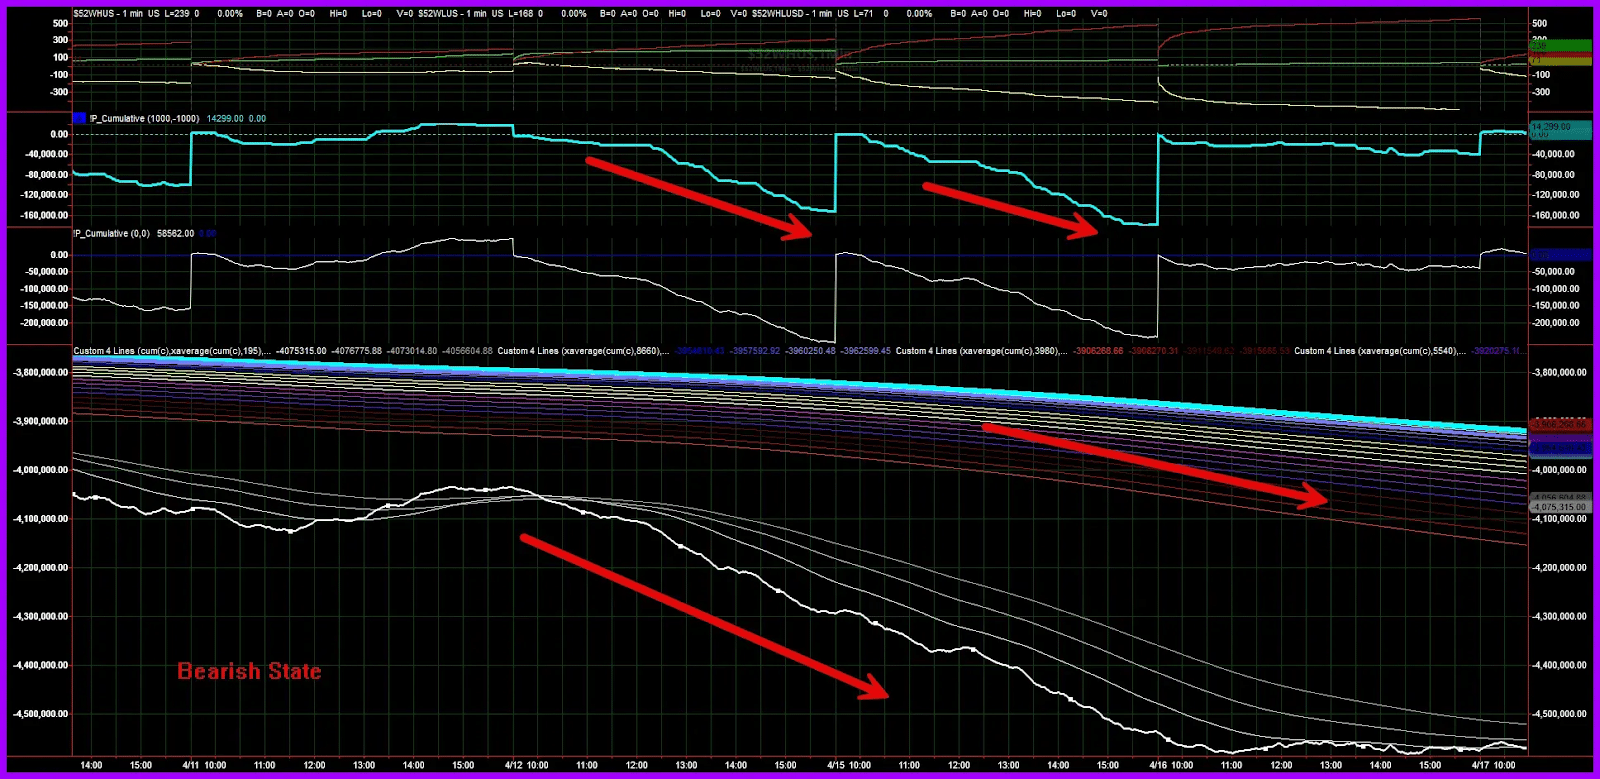
And here is another example of one that is bearish in nature. The stark difference in the direction of momentum should jump off the page at you!
Further — this direction should mean one thing when buying call options vs put options:
You always want to be on the side of the market’s trend!
While the Market Trend Model shows you momentum when determining call options vs put options, SPX structure analysis reveals who’s actually in control – call speculators (bulls) or put speculators (bears).
GammaEdge Solution: Visual Market Structure
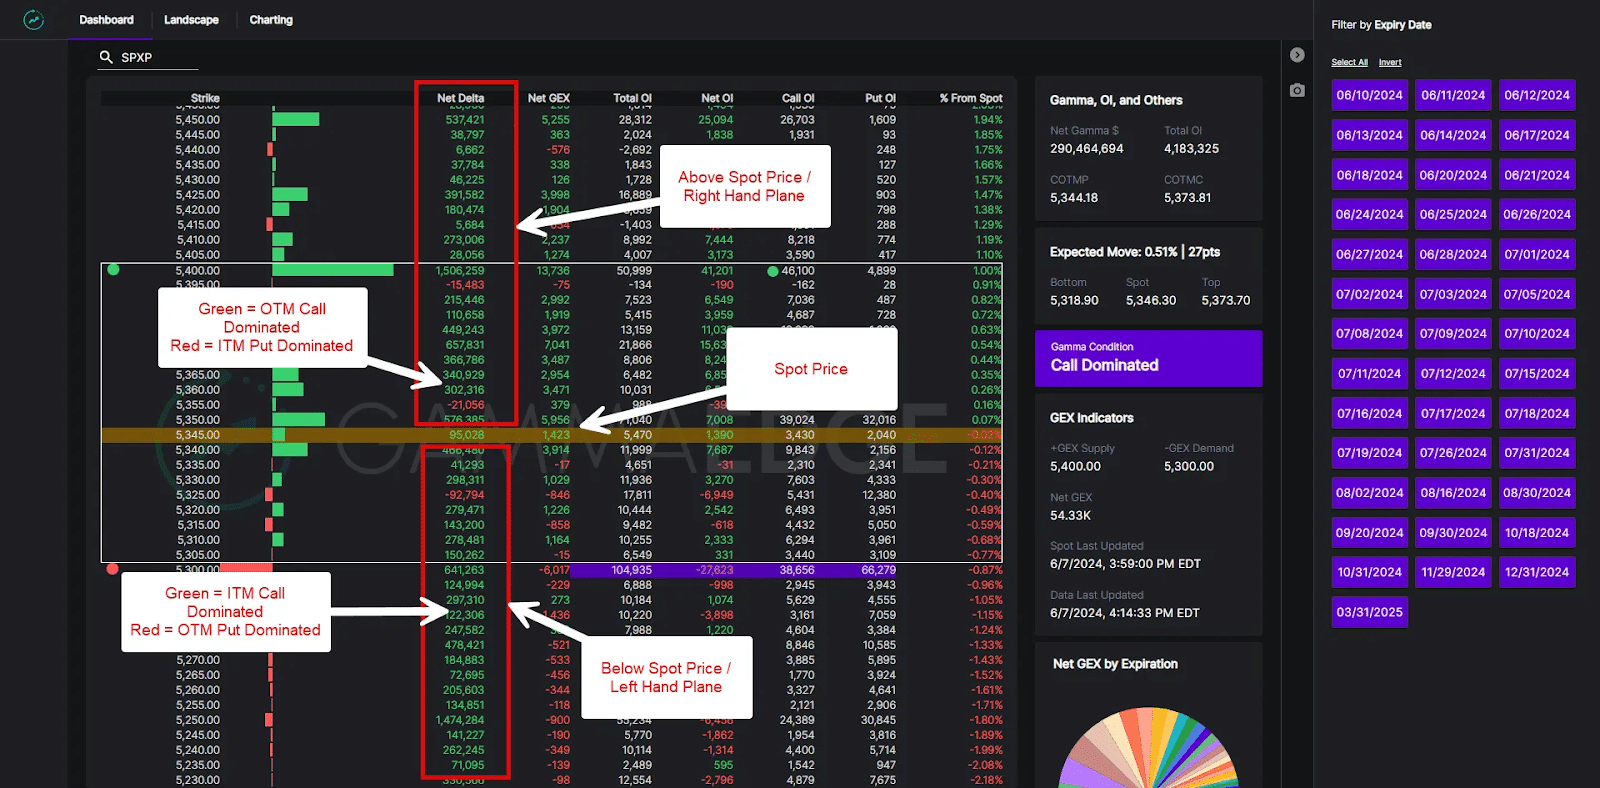
Using our Web App Dashboard, you can instantly see:
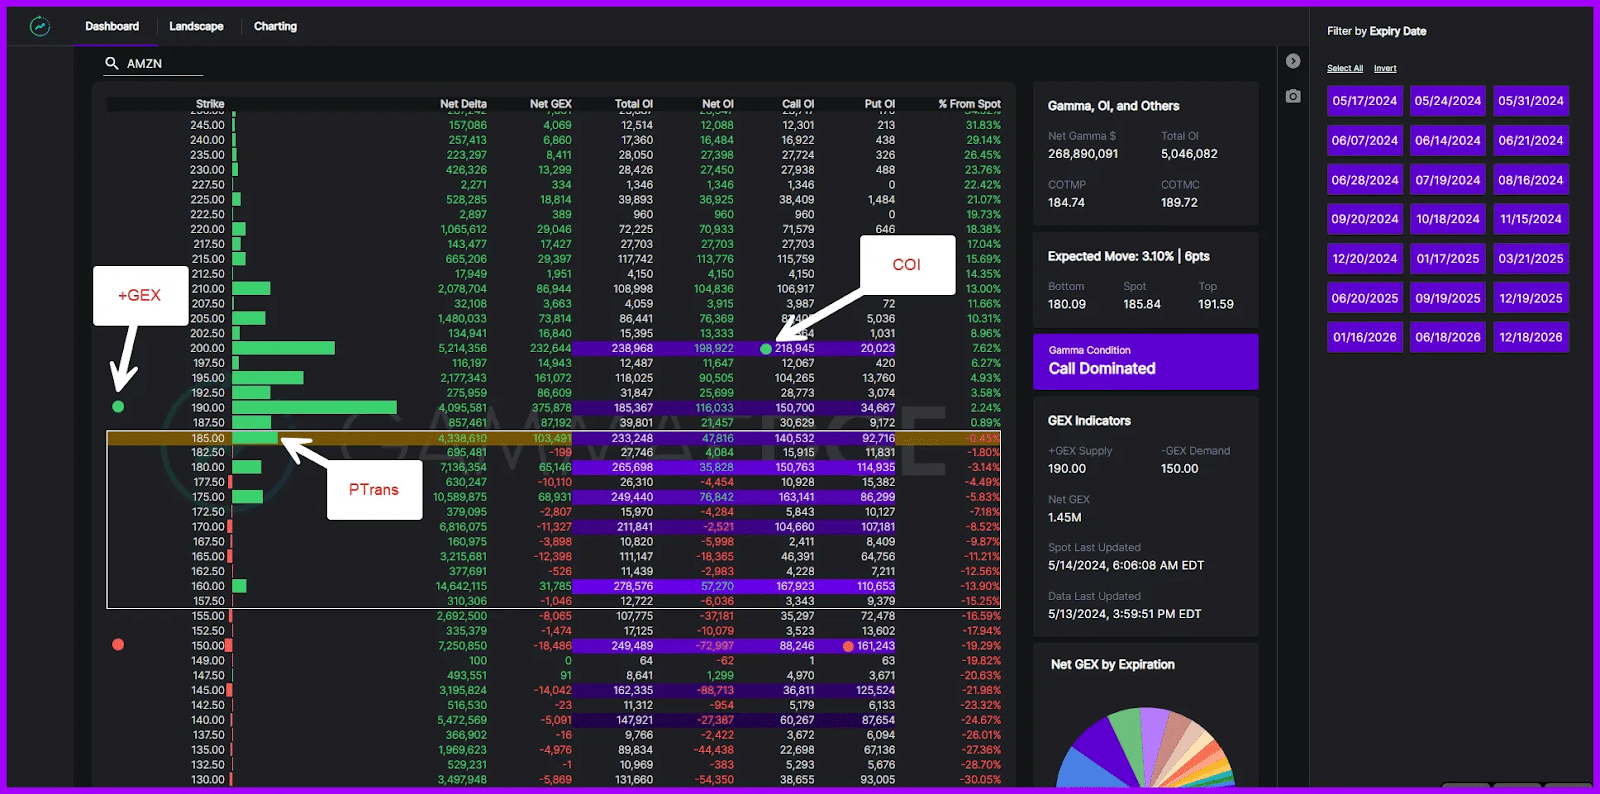
Call vs Put Dominance
And so you have it for your reference and knowledge, the above dashboard visual shows us the structure is “green”, which indicates to us that there is a call-dominated environment. This is likely when you’ll want to be buying call options vs put options.
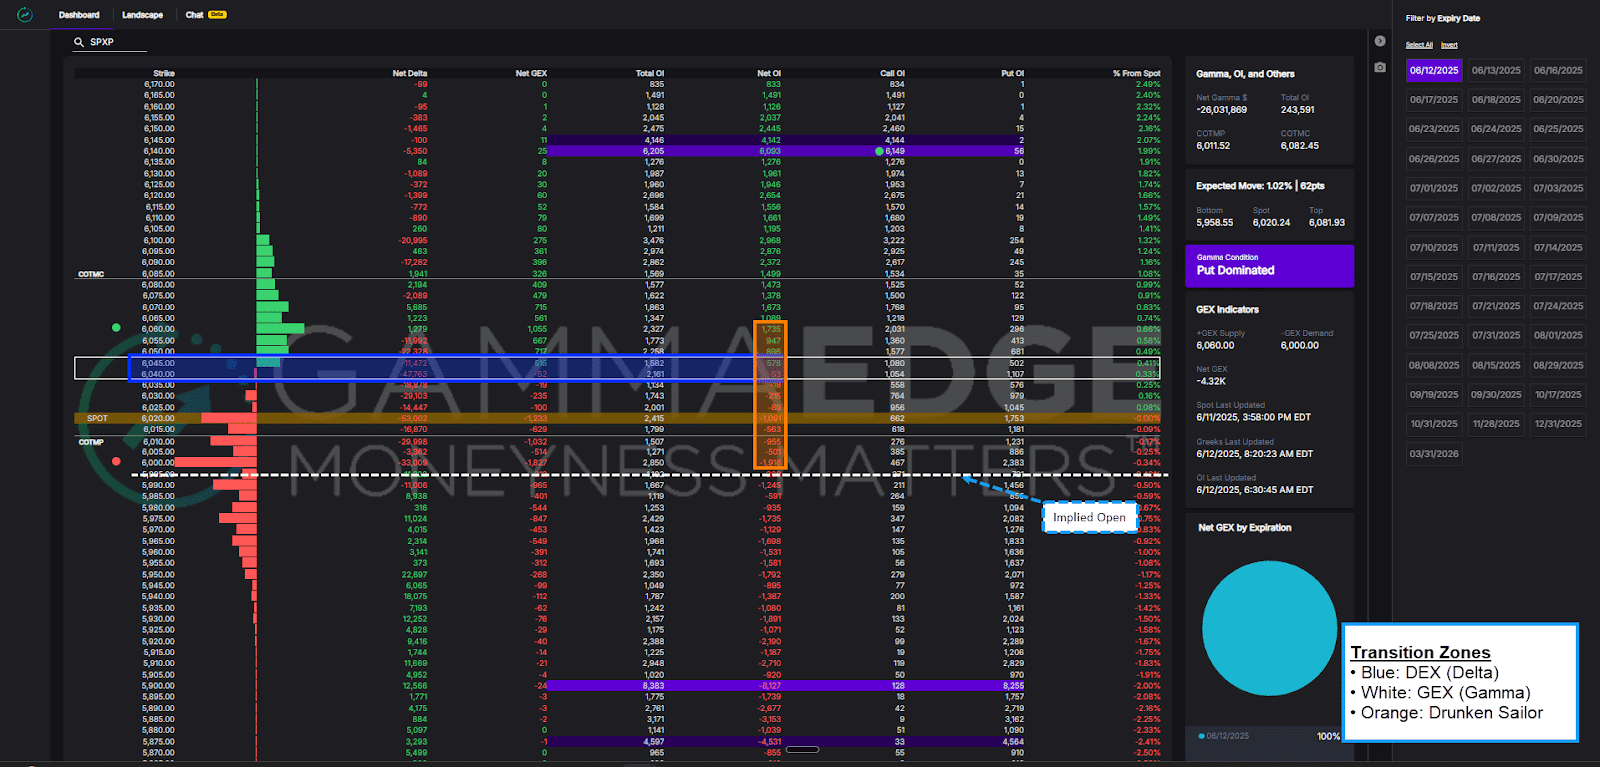
Now compare that to the structure below which is red, which indicates a put-dominated environment. This is likely when you’ll be buying put options vs call options.
That’s the beauty of our dashboard, it quickly allows us to visualize the options market positioning for any underlying.

Transition Zone Analysis
The GammaEdge transition zones are critical to our trading framework. There are three key transition zones we have developed which are built off of Gamma, Delta, and the distribution of speculation (aka Drunken Sailor Range), These zones were designed show us the areas of congestion in the structure as well as the areas where price should see a continuation move higher or lower, depending on which side of the transition zone is breached.
Key Structural Levels
The beauty of our systematic process to buying call options vs put options is there is no subjectivity to it. We utilize the options market structure to understand what strikes key speculators have targeted. This then helps to inform us as to the short-term potential for an upside move (above the transition zone) or downside move (below the transition zone) the trade may have.
Based on your analysis, classify the current market environment when determining call options vs put options:
Bullish Environment (Focus on Calls)
Bearish Environment (Focus on Puts)
Choppy Environment (Avoid Directional Trades)
The Critical Rule: Never fight the market environment. If your analysis shows bearish conditions, don’t look for call opportunities hoping to catch a reversal. Focus exclusively on the direction that market structure supports.
Once you’ve classified the market environment using these systematic criteria, determining your directional bias becomes straightforward.
Once you’ve assessed the market environment, determining your directional bias to call options vs put options becomes straightforward. This isn’t about abandoning your existing analysis – it’s about enhancing it with structural intelligence that dramatically improves your probability of success.
Rather than making directional decisions based on individual stock analysis alone, you now align your trades with the dominant market forces that can either amplify or undermine your positions.
When Market Environment = Bullish
Focus exclusively on call options vs put options during this session. Your existing technical analysis, fundamental research, or momentum strategies become significantly more powerful when aligned with supportive market structure.
Here’s what this means practically:
When Market Environment = Bearish
Focus exclusively on put option opportunities during this session. Your bearish analysis – whether technical breakdowns, fundamental concerns, or short-selling signals – gains structural support from the broader market environment.
Practical implementation:
When Market Environment = Choppy This is when discretion becomes the better part of valor. Choppy environments can turn even the best individual stock analysis into coin flips, regardless of your analytical approach. This is key to understand — not every environment is healthy for call options vs put options buying.
During these periods:
The key insight: Market environment analysis doesn’t tell you which specific stocks to trade – it tells you which direction has the highest probability of success when buying call options vs put options, allowing you to focus your existing analytical skills where they’re most likely to work.
If you’re a technical analyst, you still use your patterns and indicators. But now you know whether to look for bullish or bearish setups based on what market structure supports.
If you use momentum strategies, you still identify stocks with strong price action. But you filter for momentum in the direction that market forces support.
Here’s where many traders go wrong: They identify a compelling individual setup that contradicts the market environment and convince themselves “this time is different.”
Example scenario: Market environment shows clear bearish structure – selling pressure across multiple timeframes, put dominance in SPX, institutional money moving to the sidelines. But you find a stock with a perfect cup-and-handle pattern and decide to buy calls anyway.
The result: Even if your technical analysis is perfect, you’re swimming against the current. Market structure can overwhelm individual stock patterns, turning winning analysis into losing trades.
The GammaEdge approach: When the market environment is bearish, focus your analytical skills on finding the best opportunities (or sit in cash, because that is a position too!). Save your bullish analysis (and emotional capital) for when market structure supports it.
This discipline is what separates consistently profitable options traders from those who rely on hope and luck.
Daily Routine Enhancement:
The Power of Alignment: When your individual stock analysis aligns with supportive market structure, your success rate improves dramatically. You’re not just trading good setups – you’re trading good setups with structural tailwinds.
This doesn’t guarantee success on every trade, but it significantly improves your odds by ensuring you’re working with market forces rather than against them.
Now that you know your directional bias, the next challenge is finding the specific stocks where that directional thesis has the best chance of success. Traditional stock screening often feels like searching through haystacks – scanning hundreds of charts hoping something jumps out at you.
GammaEdge transforms this process by showing you exactly where options positioning supports your directional bias before you even look at a chart.
Our specialized scans filter the entire market for stocks where options positioning aligns with your systematic directional bias. Instead of hoping your technical analysis overcomes hostile positioning, you’re focusing on stocks where smart money is already positioned in your direction. Further, rather than scrolling through hundreds (or even thousands) of price charts, we help you filter down quickly (within seconds) to a curated list, which you can then apply your additional analysis to.
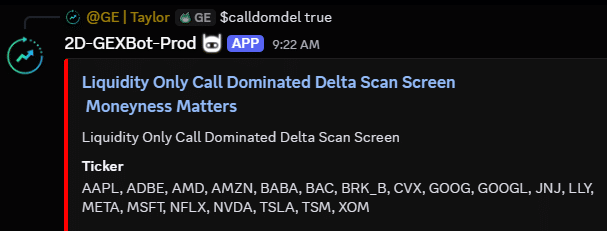
For Call Option Targets (When Market Environment = Bullish)
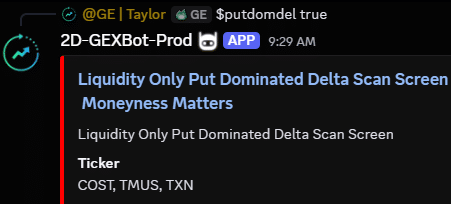
For Put Option Targets (When Market Environment = Bearish)
$putdomdel ( Put-Dominated Structures): Shows stocks where put positioning controls key strikes above and below current price. These stocks have structural support for downward moves.
The Key Advantage: You’re not trying to predict where smart money will go – you’re identifying where it’s already positioned and trading alongside those structural forces.
Bullish Market Environment Example:
Bearish Market Environment Example:
These scans don’t replace your current stock selection methods – they enhance them by providing a structurally intelligent starting point.
Rather than analyzing hundreds of random stocks, you’re now focusing your analytical skills on perhaps 5-10 candidates where options positioning supports your directional thesis.
This focused approach means:
The scans transform stock selection from a time-consuming search process into a systematic identification of structurally aligned opportunities where your existing analytical skills have the best chance of success.
Having the right market environment and structurally aligned stocks is powerful, but timing your entry can make the difference between a winning trade and watching your options lose value while you wait for movement.
This is where transition zones become critical – they show you exactly when to pull the trigger on your options trades.
Transition zones represent the price levels where market control shifts between call and put speculators. Think of them as the market’s natural acceleration points – areas where breaking through triggers structural forces that can amplify your option positions.
For Call Entries (When Market Environment = Bullish)
Your structurally aligned stock must meet this key criteria:
Trading Above PTrans (Positive Transition)
Confirm Upside Targets
Verify Market Support
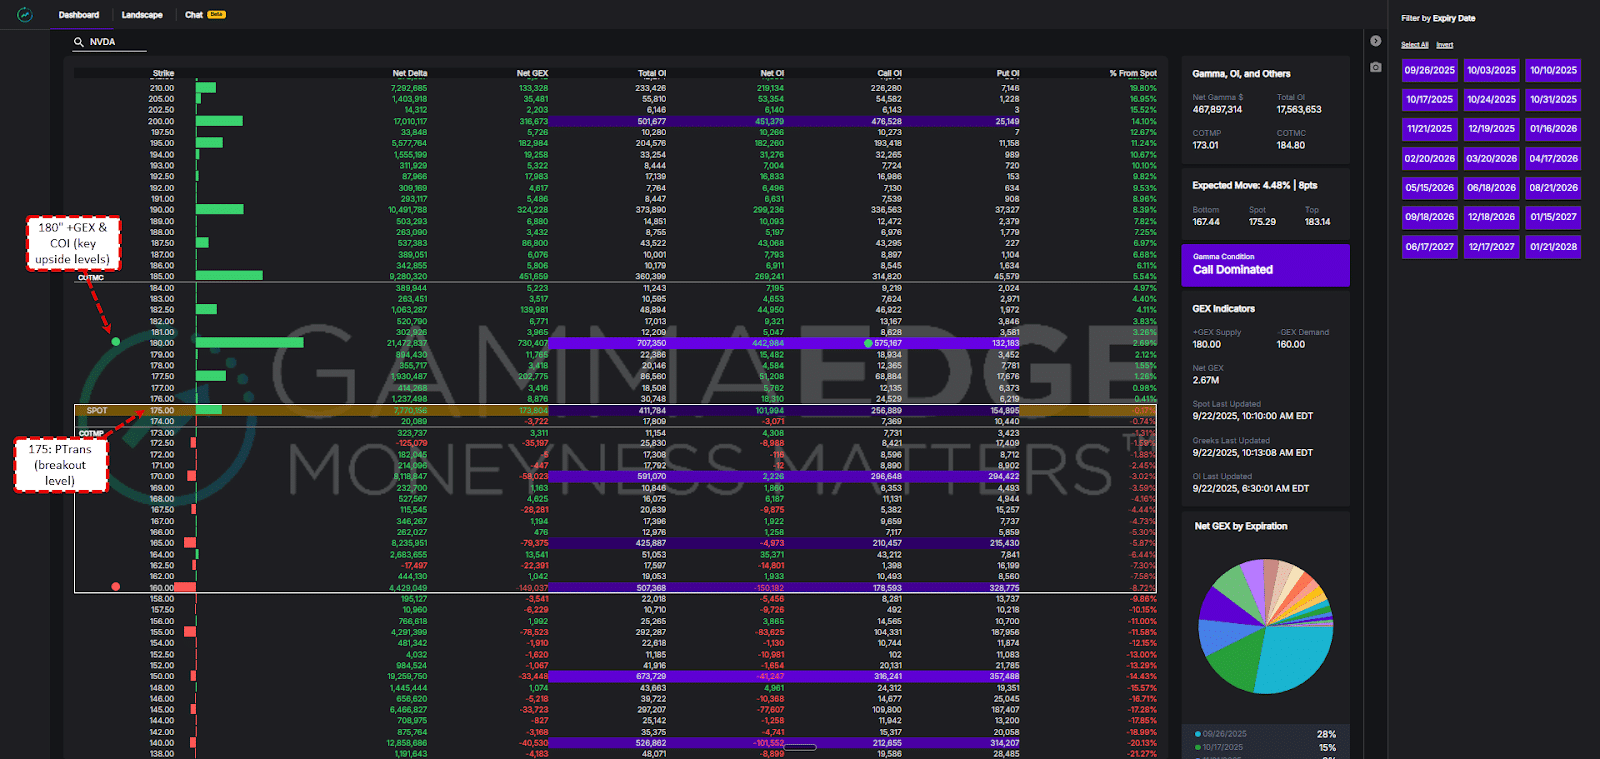
And to help you better understand this concept, let’s walk through an example of $NVDA below (assume the Market Trend Model is showing momentum to the upside). We’ve highlighted the key levels for you:
Pro-tip: It’s important to review these levels day over day as they will move as speculators change their positioning. For example, in a bullish environment, we should see +GEX and COI continue to progress higher ahead of spot price as price itself moves higher. This tells us that speculators are continuing to expect further upside.
For Put Entries (When Market Environment = Bearish)
Your put candidates need this structural validation:
Trading Below NTrans (Negative Transition)
Confirm Downside Targets
Verify Market Support
The highest-probability entries occur when multiple GammaEdge tools confirm the same directional thesis:
Maximum Confluence Example:
When this many indicators align, you’re not gambling – you’re systematically positioning when structural forces support explosive option moves.
For Call Options:
For Put Options:
Risk Management Integration:
Traditional options trading often relies on hope: “I think this stock will move, so I’ll buy options and see what happens.”
The GammaEdge framework eliminates guesswork:
This systematic approach doesn’t guarantee every trade will work, but it dramatically improves your odds by ensuring multiple layers of analysis support your directional thesis before you risk capital.
The difference between struggling with options direction and consistently making profitable choices isn’t luck or market timing – it’s having a systematic framework that aligns your trades with the dominant structural forces driving today’s markets.
What we’ve covered today without a doubt got you closer to finding when to buy call options vs put options, and here’s how:
The Complete GammaEdge Framework:
Key Insight: This framework doesn’t replace your existing analytical skills – it enhances them by showing you when and where those skills have the highest probability of success.
Start Implementing Today:
Free Resources to Accelerate Your Learning:
This systematic approach may represent a new way of thinking about markets. That’s exactly why we created our flagship educational course called the GammaEdge FastPass, designed to significantly accelerate your learning curve as it relates to all things options market analysis.
As with all our education, it’s completely free and gives you everything a paid member gets:
We hold nothing back. Get your copy of the FastPass here: