%201.avif)

What is a Put Option? Complete Guide to Buying Puts (2025)
.png)
Taylor Drake
.png)
December 12,2025
.png)
15mins read
A put option gives you the right, but not the obligation, to sell 100 shares of stock at a specific price (strike price) until a specific date (expiration). Unlike short selling, put options require less capital while providing leveraged exposure to downward price movement with strictly limited risk.
You saw Tesla’s massive breakdown coming weeks in advance. The technical setup was perfect, the fundamentals were deteriorating, but shorting 100 shares would tie up ~$45,000 in margin requirements you didn’t have.
You watched from the sidelines as Tesla dropped 10%, missing a move you predicted perfectly. What if there was a way to profit from that same move with just $1000?
What is a Put Option? Here are some key characteristics:
This scenario plays out constantly – traders with solid analysis but limited capital missing bearish opportunities because traditional approaches like short selling require substantial resources and carry unlimited risk.
When you can answer the question of what is a put option, you’ll realize they solve both problems by providing:
But Here's What Most Traders Miss
Simply knowing how put options work isn’t enough. The difference between profitable put trading and expensive lessons lies in understanding:
You need to see not just that a stock might decline, but where the underlying forces create the highest probability for that decline to accelerate your put options’ value.
A Note About Selling Options: While this article focuses on buying put options, it’s worth noting that options can also be sold to collect premium income. Selling options involves different risks and strategies that we’ll cover in a dedicated guide. For beginners, focus on mastering the buying side first.
While traditional technical analysis (or any other form of market analysis) provides the foundation for identifying potential put opportunities, there’s an additional layer of market intelligence that can significantly improve your timing and strike selection.
Most traders approach put options by:
This approach works, but it’s missing crucial information about what’s happening beneath the surface.
Modern markets are increasingly driven by options markets and the positioning speculators within. When thousands of traders position themselves with puts at specific strikes, it creates measurable forces that can either support your trade or work against it.
GammaEdge’s options structure analysis reveals:
Think of it this way: traditional analysis shows you what might happen to price. Options structure analysis shows you where and when those moves are most likely to create explosive put option gains.
Instead of guessing whether your puts will work, you can see:
This additional intelligence doesn’t replace your existing analysis – it amplifies it by showing you the underlying forces that drive put option success.
Now let’s dive into how put options actually work, so you can understand exactly what you’re buying and how to use them effectively.

Think of a put option as a leveraged insurance policy with profit potential. When you buy a put, you’re paying a premium for the right to benefit from downward stock movement while limiting your downside to what you paid.
But understanding the mechanics is just the beginning. To trade puts successfully, you need to grasp why they behave differently from stocks, how to choose the right strikes for your situation, and most importantly, how to avoid the common mistakes that turn winning predictions into losing trades.
When you buy a put option, you’re purchasing the right to sell 100 shares at a specific price until expiration. Here’s a practical example:
Tesla is trading at $420, and you buy a $410 put option for $10 ($1,000 total for the contract). This gives you:
Critical Insight: Unlike owning stock where you need the price to go up to make money, puts make money when stocks go down. But the amount you make depends on how far they fall, how quickly they fall, and several other factors we’ll explore.
Put options gain value through multiple mechanisms, and understanding each one helps you avoid costly mistakes:
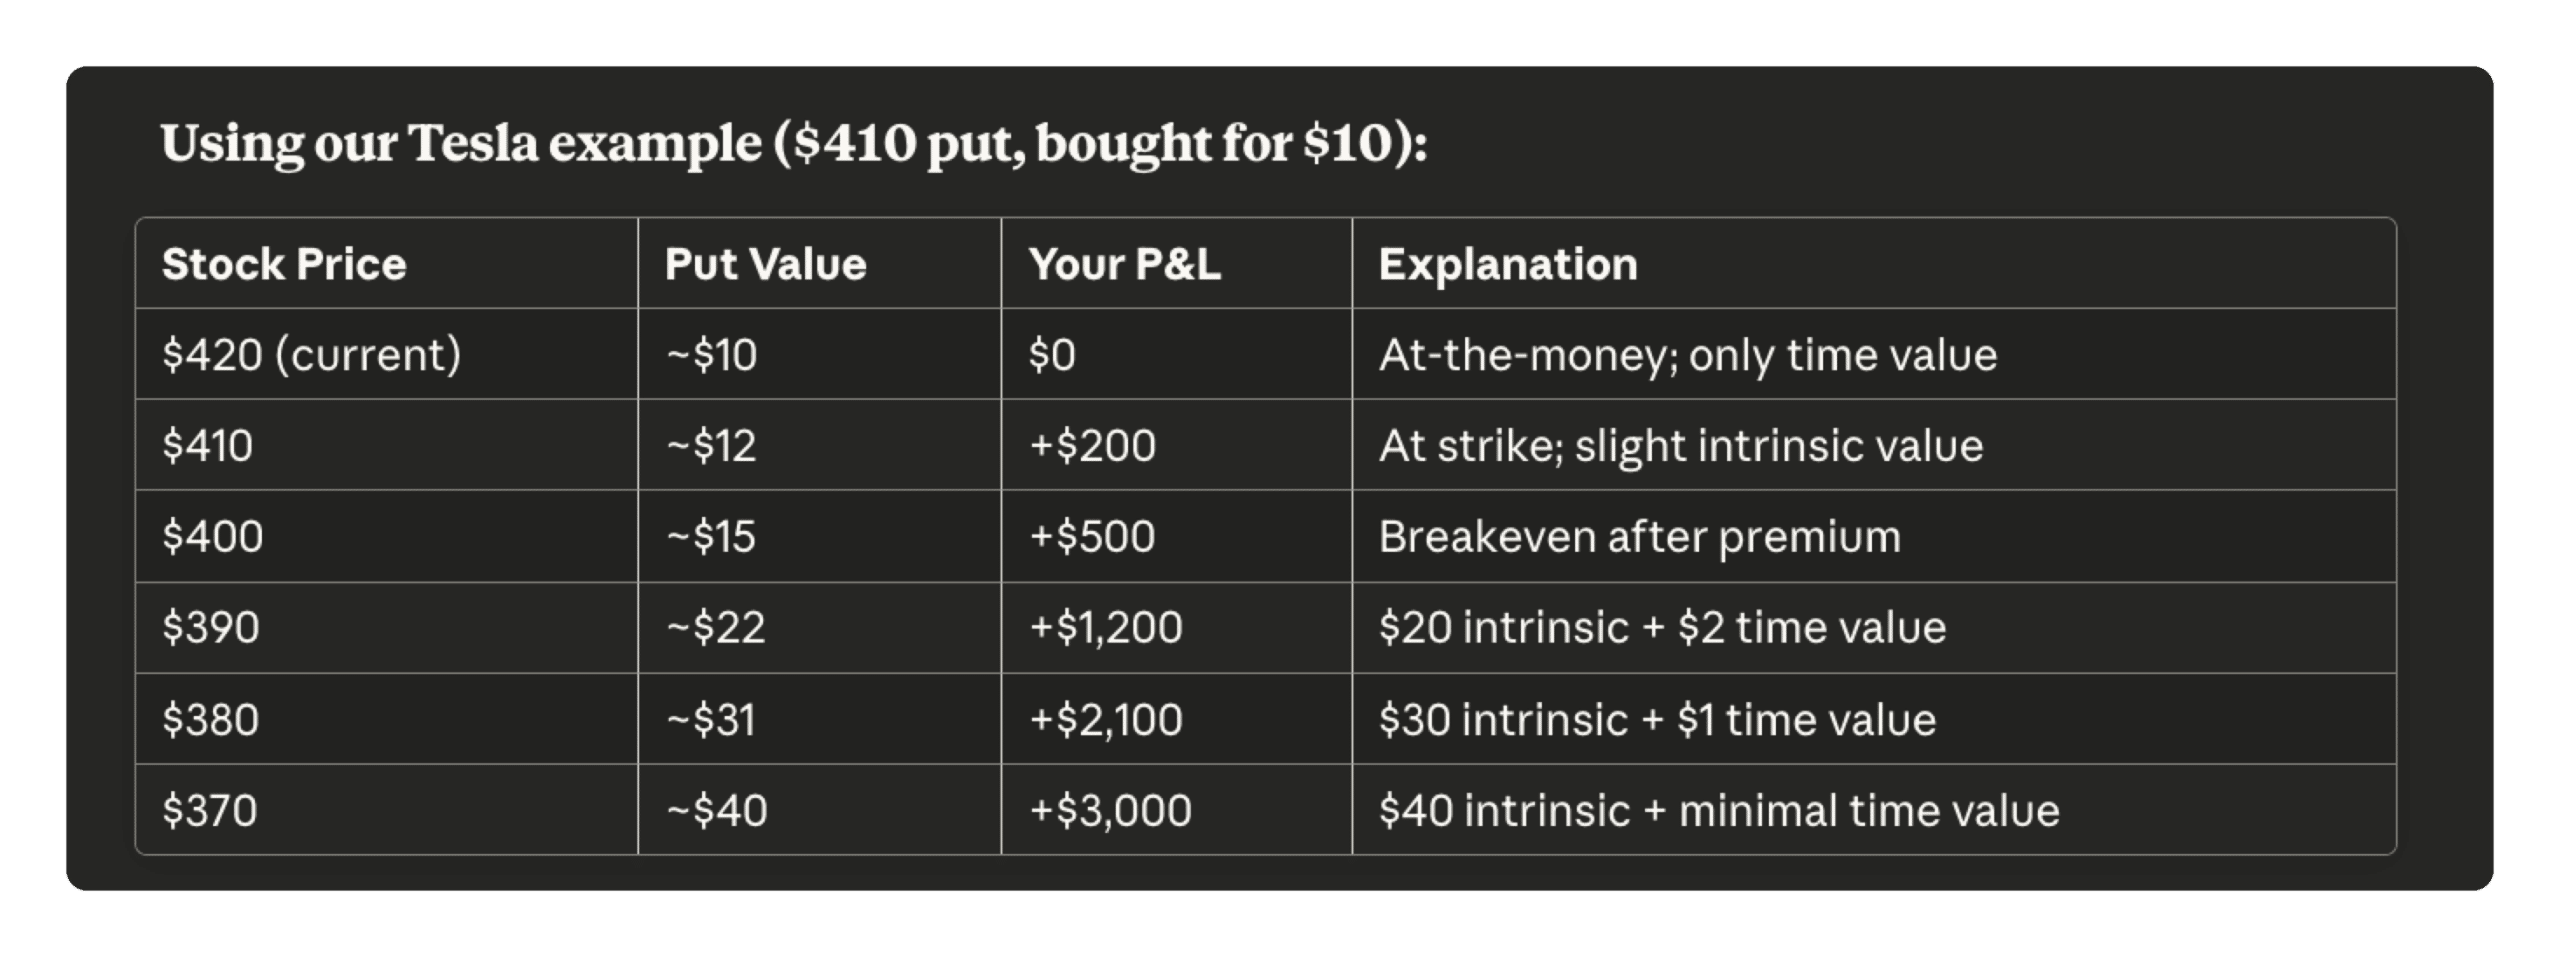
Your put becomes more valuable as the stock price falls below your strike price. Using our Tesla example:
Here’s what beginners miss: The put doesn’t just need the stock to fall – it needs to fall enough to overcome the premium you paid. A 5% drop might not be enough if you paid a high premium.
When markets become fearful or uncertain, put option premiums often increase even before stocks decline significantly. This creates a powerful accelerator effect:
Why this happens:
The trap: Volatility can crush your puts. If you buy puts when fear is already high and the feared event passes without major damage, volatility collapses and your puts lose value even if the stock stays flat.
This is where many new put traders get burned. Every day that passes, your put option loses some value due to time decay – even if the stock doesn’t move.
How time decay works:
Strategic insight: Time decay accelerates as expiration approaches. Buying puts with only a few days left is extremely risky unless you expect immediate, large moves.
Here’s what a put option’s profit/loss looks like at expiration, with the critical details most guides skip:
Tesla $410 Put bought for $10:
But here’s what really matters for active trading:
You don’t have to hold until expiration. Most successful put traders sell their contracts when they’ve captured a good portion of the move, rather than hoping for maximum profit.
Example profit scenarios before expiration:
Notice how timing affects your returns even with the same stock move.
Most bearish traders immediately think of short selling, but the comparison reveals why puts often provide superior risk-adjusted returns:
Why this matters: With puts, you can take the same bearish position while keeping $40,000 available for other opportunities or as protection against unexpected losses.
Real scenario: During short squeezes, short sellers can face margin calls requiring immediate capital or forced liquidation at terrible prices. Put option holders simply watch their premium disappear – painful, but not account-threatening.
Here’s a side-by-side comparison using Tesla dropping from $420 to $370:
Short 100 shares:
Buy $410 puts for $10:
Key insight: While short selling captured more absolute dollars, puts provided dramatically better return on capital deployed.
Quick Summary: Why Puts Often Beat Short Selling
Your strike choice determines everything about how your put behaves. Here’s how to match strikes to your specific situation and market outlook:
Strike above current stock price
When Tesla is at $420, buying $450 puts:
Best used when:
Example scenario: “I believe Tesla will grind lower over the next month due to fundamental deterioration. I want exposure that won’t get crushed by time decay.”
Trade-off: Higher cost means fewer contracts for the same capital, but much higher probability of profit.
Strike near current stock price
When Tesla is at $420, buying $420 puts:
Best used when:
Example scenario: “Technical analysis suggests Tesla could break down, but I’m not certain when. ATM puts give me good exposure with reasonable cost.”
Trade-off: Meaningful time decay risk, but good balance of cost and potential returns.
Strike below current stock price
When Tesla is at $420, buying $380 puts:
Best used when:
Example scenario: “Tesla earnings could be a disaster. I’ll risk a small amount on OTM puts that could explode if I’m right about a major decline.”
Trade-off: Need significant stock movement just to reach breakeven, but massive profit potential if you’re right.
Ask yourself these questions:
Quick Summary: Choosing Your Strike
OTM Puts: Lowest cost but need large moves, best for portfolio protection or big expected declines
Understanding these price drivers helps you avoid the mistake of being right about direction but still losing money:
This is the amount your put is “in-the-money” right now:
Key insight: Intrinsic value can’t disappear due to time decay. It’s real money you could capture by exercising the option.
This represents what traders will pay for the chance that your put could become profitable:
Critical understanding: Time value disappears at an accelerating rate. A put worth $5 in time value today might be worth $2 next week and $0 at expiration – even if the stock doesn’t move.
Example: Tesla $410 put with stock at $420:
This measures the market’s expectation of how much Tesla will move during your option’s lifetime:
Volatility scenarios that affect your puts:
High volatility situations (puts get expensive):
Low volatility situations (puts get cheap):
The volatility trap: Many new traders buy puts when volatility is already high (after bad news), then lose money when volatility drops even if the stock continues falling.
Quick Summary: What You’re Paying For
Critical Point: You can be right about direction but still lose money if you pay too much for time or volatility. The best put opportunities often occur when options structure analysis is bearish but volatility hasn’t spiked yet.
Now that you have a solid foundation in put option mechanics and pricing, let’s explore how GammaEdge’s options structure analysis can help you identify the highest-probability put trades and optimize your strike selection for maximum effectiveness.
Now that you understand put option mechanics, let’s see how GammaEdge’s options structure analysis transforms put trading from educated guessing into systematic positioning.
Traditional put trading leaves too much to chance. You identify a bearish setup, pick a strike based on technical levels, and hope everything works out. GammaEdge’s systematic approach gives you visibility into the actual forces that drive put option success.78
Let’s walk through our complete methodology using Bristol-Myers Squibb (BMY) as a real example, showing you exactly how each tool works and why this systematic approach consistently outperforms traditional analysis.
GammaEdge Solution: Web App Dashboard Analysis
Before entering any put trade, we need to see if the options market structure actually supports downward moves. Traditional technical analysis can show you bearish chart patterns, but it can’t reveal where thousands of options traders have positioned their money.
The GammaEdge Web App Dashboard changes this by visualizing the actual positioning of options speculators across every strike price that helps to paint a mosaic for us of the entire structure.
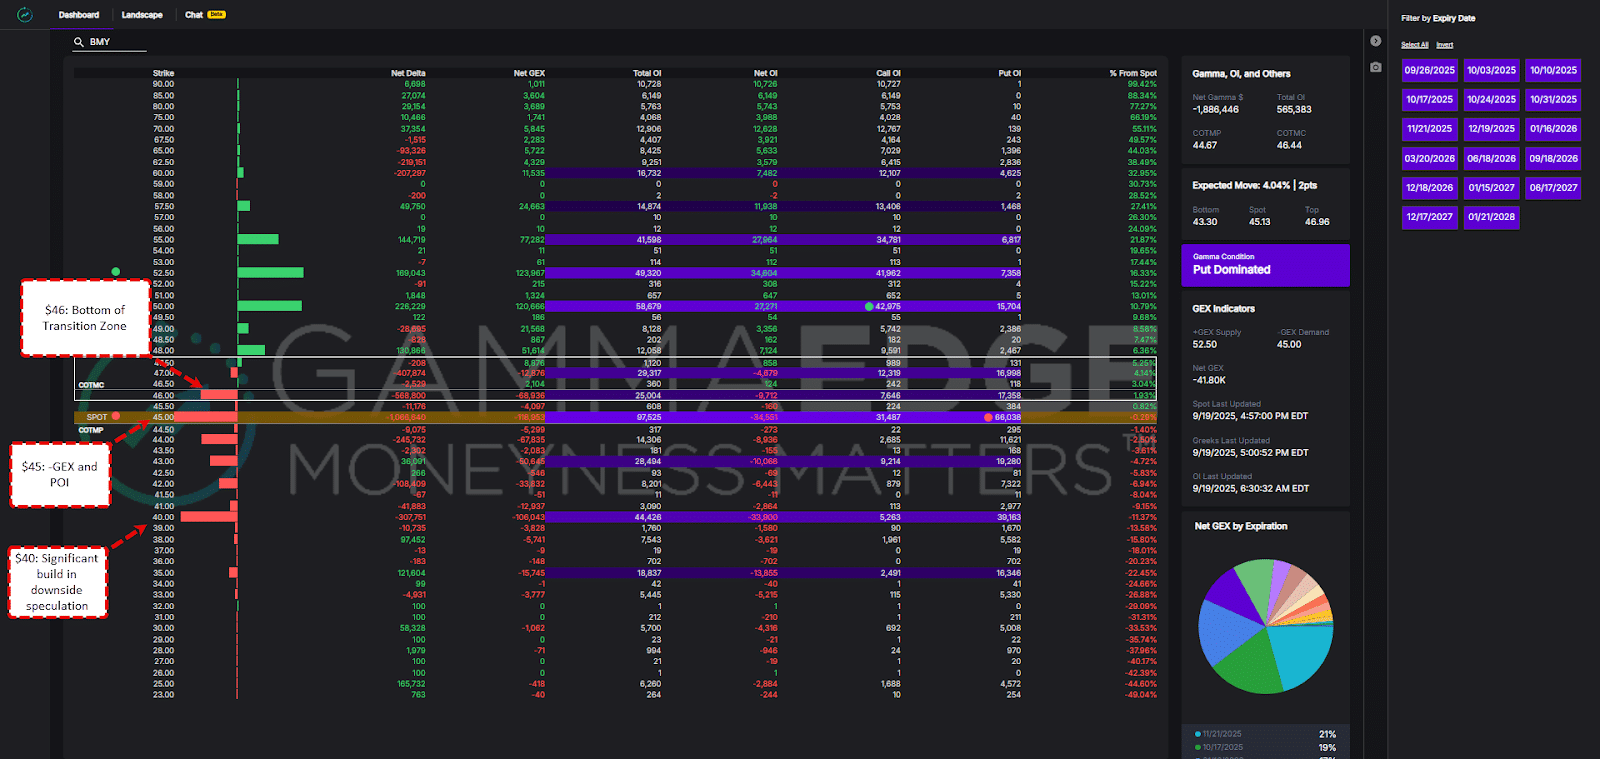
What we see immediately:
Why This Matters: These zones represent where thousands of traders have positioned for downward moves. When price approaches these areas, their collective positioning creates structural forces that can amplify your put gains (or work against them).
The dashboard shows us that BMY isn’t just technically weak – it’s structurally positioned for meaningful downside. This single tool can provide you a significant edge and compliant your existing trading system.
Contrast with Call-Dominated Structure:
To understand the power of this analysis, here’s what a bullish structure looks like:
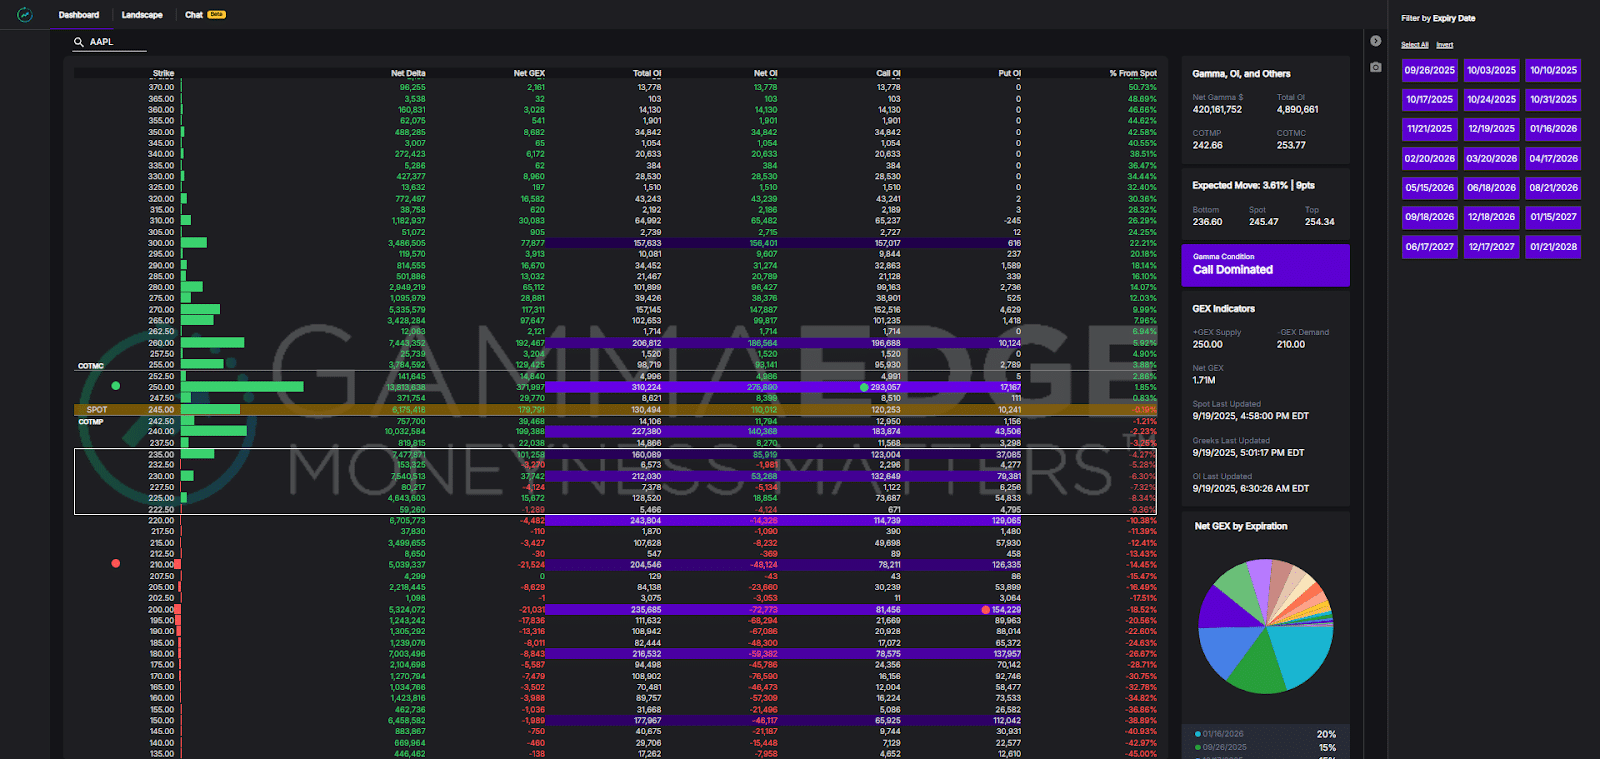
The difference is immediate: green strikes dominate above and below spot price, with price trading above the transition zone. This structure favors upward continuation, not downward breakdown.
GammaEdge Advantage: While traditional traders guess about market sentiment, you can see exactly where the smart money is positioned.
Step 2: Verify Sentiment is Building, Not Stretched
GammaEdge Advantage: Multi-Timeframe Sentiment Analysis
Traditional analysis struggle to tell you if under the hood, bearish sentiment is beginning or already exhausted. Sure, you can use moving averages, RSI, etc., but those aren’t based on actual speculator positioning, just historical price action. Our sentiment tools provide clear answers on how speculators are positioned out in time.
Force #1: GEX Ratio Analysis
The GEX Ratio measures cumulative call gamma relative to cumulative put gamma – a sophisticated put/call ratio that incorporates the critical element of time. Unlike traditional ratios that treat all options equally, the GEX Ratio naturally emphasizes near-term positioning where the real action occurs.
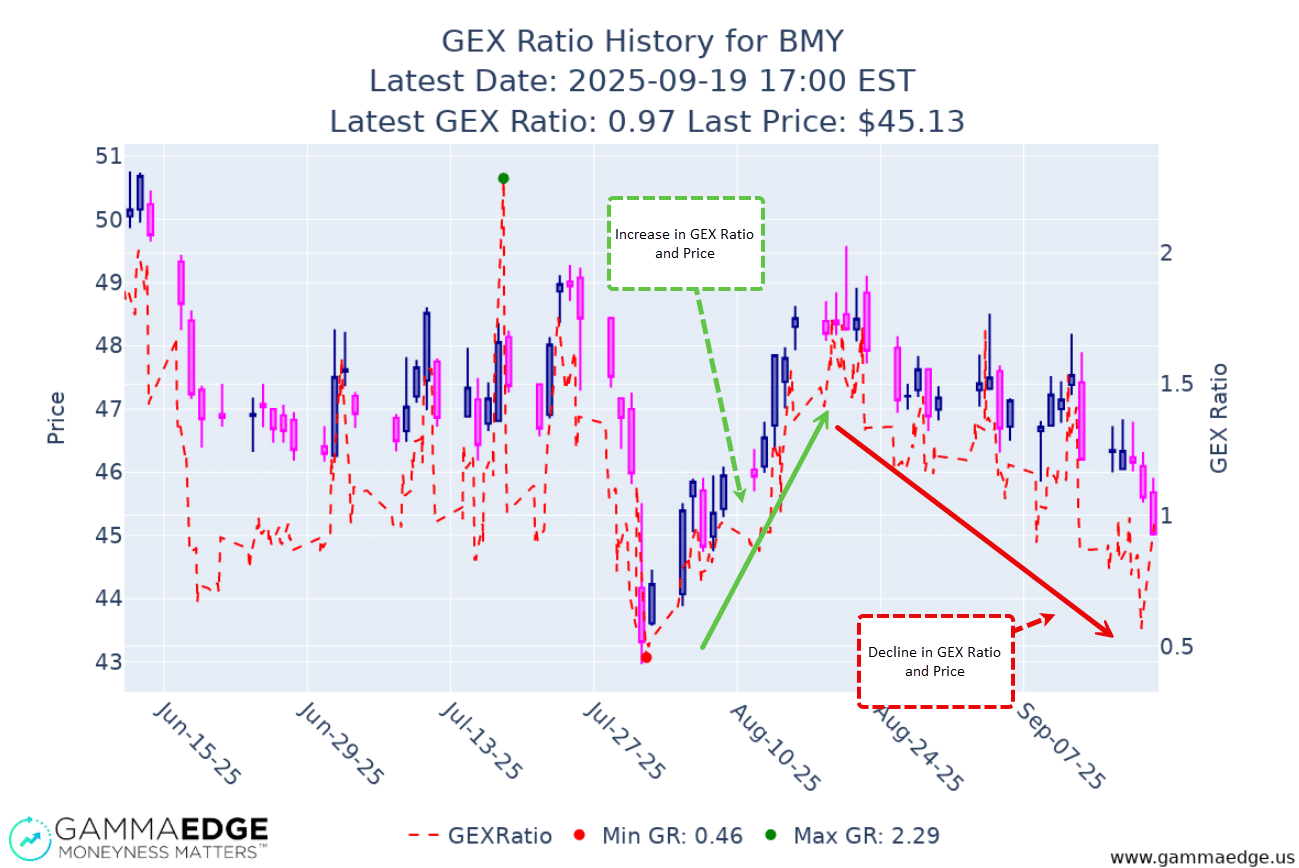
What This Reveals: For BMY, the ratio has been decisively trending lower and currently sits below 1.0, indicating put speculation has been systematically building while call buying dries up. This isn’t a one-day reaction to bad news – it’s sustained bearish momentum building over time.
Critical Insight: You’re not buying puts after the move. You’re positioning as bearish sentiment builds, giving you structural support for your trade.
Force #2: Delta Balance Confirmation
Most market analysis is backwards-looking – showing you what happened through price charts, volume patterns, or sentiment indicators based on recent activity. The GammaEdge Delta Balance tool provides something completely different: visibility into how speculators are positioned across future time horizons.
Why This Forward-Looking View Matters: While current market action tells you what traders think today, Delta Balance reveals what smart money expects weeks and months ahead. This creates a unique edge – you can see developing sentiment shifts before they appear in traditional indicators.Remember, options markets are inherently forward looking and this exactly what the Delta Balance tool helps to visualize for us.
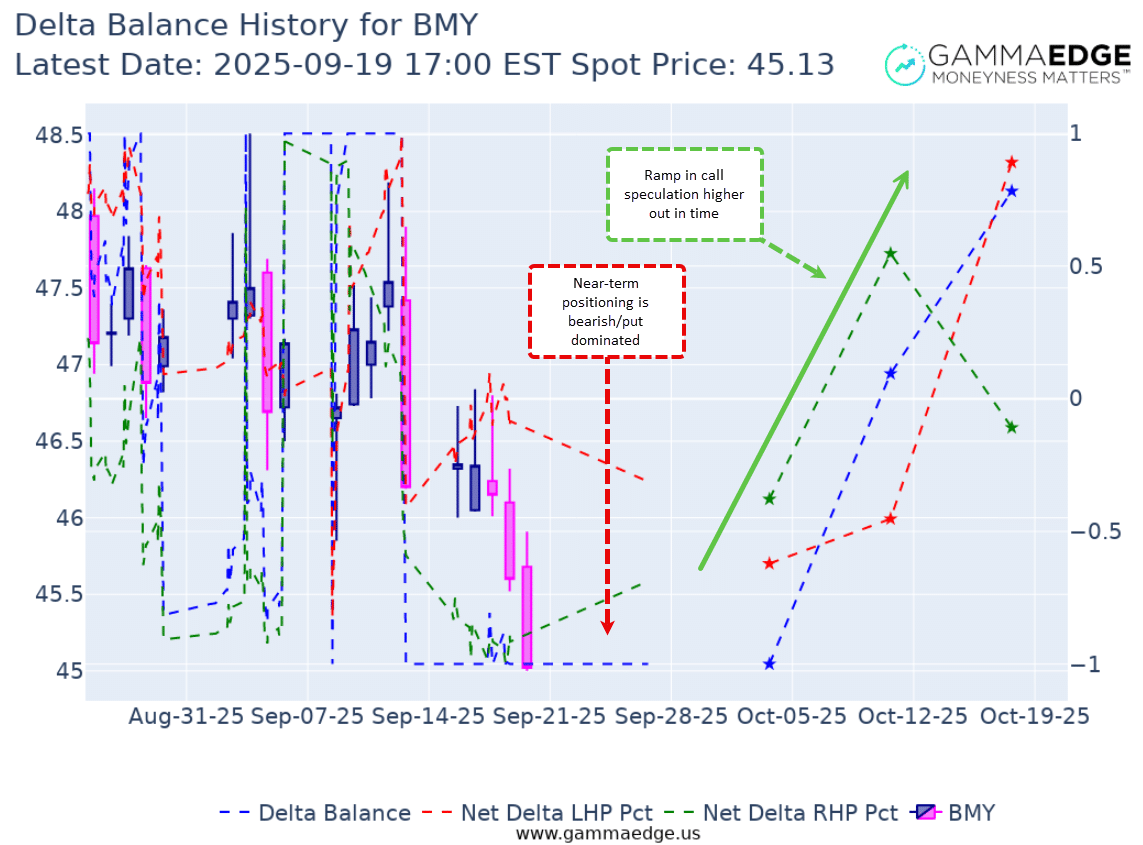
What We Discover: While current expirations show clear put dominance, the longer-dated expirations reveal something crucial. The bearish positioning starts to meaningfully change out in time, suggesting we shouldn’t press our luck too far to the downside.
Strategic Implication: This forward-looking intelligence tells us the bearish trade has potential but isn’t unlimited. If sentiment starts shifting in future expirations, we’ll also see it in the GEX Ratio – these tools work together to provide complete market intelligence.
GammaEdge Advantage: Traditional sentiment indicators show you what happened. GammaEdge tools show you what speculators expect to happen across multiple timeframes.
Step 3: Time Entry with Market Trend Model
GammaEdge Method: Confirming Selling Pressure
Technical breakdowns mean nothing without actual selling pressure behind them. The GammaEdge Market Trend Model, built off the Tick Index, reveals when real money flow supports your put trade.
Traditional analysis shows you chart patterns. The Market Trend Model shows you the actual buying and selling flows that create those patterns.
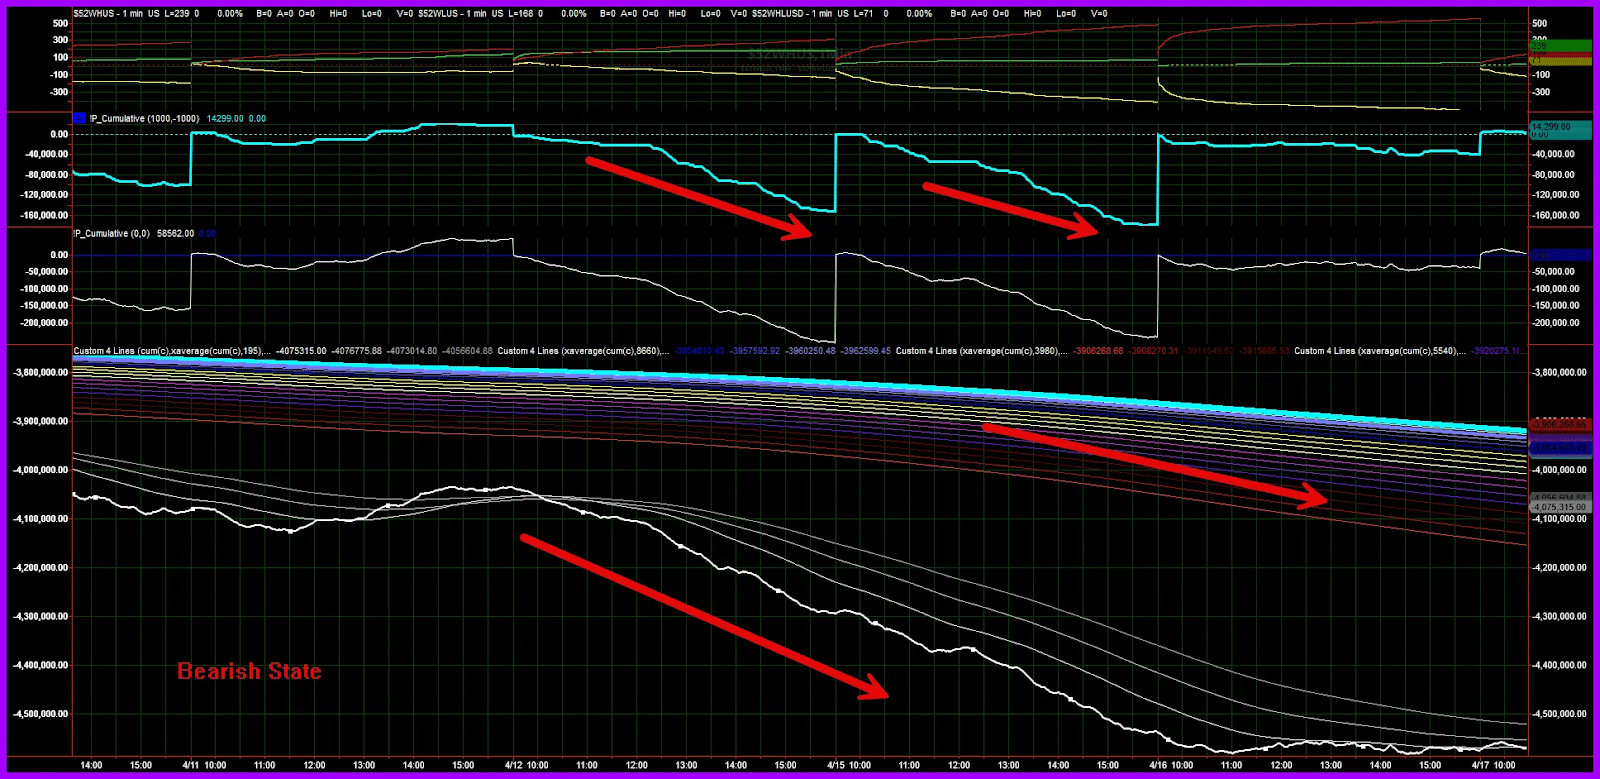
Force #3: Real-Time Flow Analysis
What we’re looking for:
Why This Convergence Matters: This confirms that BMY’s technical breakdown isn’t happening in isolation. The broader market environment supports bearish moves, and institutional money is actively participating in the selling.
When you combine bearish options positioning with confirmed selling pressure across multiple timeframes, you’re aligning with powerful forces that support put option acceleration.
GammaEdge Advantage: Instead of hoping your technical analysis is right, you can see the actual money flows that validate your thesis.
Instead of guessing which puts to buy, the structure reveals optimal strikes based on actual market positioning.
The GammaEdge Strike Selection Framework:
Strategic Approach:
The Key Intelligence: Rather than hoping $45 puts work based on technical support, you can see that significant speculation money is positioned for a move to $40. This changes your entire risk/reward calculation and gives you confidence to hold through minor bounces.
GammaEdge Advantage: Your strike selection is based on where actual money is positioned, not chart-drawing guesswork.
Once in the trade, GammaEdge tools provide clear management guidance that removes guesswork:
The systematic analysis helps determine appropriate risk:
The difference becomes clear when you compare methodologies:
Traditional Technical Analysis Limitations:
GammaEdge Options Market Analysis Advantages:
The Compound Effect: When you combine solid technical analysis with GammaEdge’s options market intelligence, you’re not just trading chart patterns – you’re systematically aligning with the same structural forces that create explosive put option moves.
This isn’t about replacing your existing analysis. It’s about enhancing it with institutional-level market intelligence that most retail traders never see.
Before entering any put position, systematically run through this framework:
✓ Structural Confirmation
✓ Sentiment Analysis
✓ Trend Confirmation
✓ Strike Selection and Management
✓ Position Sizing
The key insight is that put options become dramatically more powerful when you understand the underlying forces that drive their success. Rather than hoping price action will validate your analysis, you’re positioning when multiple structural forces support explosive put option moves.
When technical analysis, options positioning, sentiment evolution, and market flows all point in the same direction, you’re not gambling – you’re systematically aligning with the forces that create successful put trades.
Put options aren’t just tools for betting against stocks – they’re precision instruments for profiting from downward moves, protecting portfolios, and expressing bearish views with defined risk. The difference between successful put trading and expensive lessons lies in understanding when market conditions actually support your trades.
Put Option Fundamentals:
GammaEdge Enhancement:
Systematic Approach:
This way of thinking may be new for folks. That’s exactly why we created our flagship educational course called the GammaEdge FastPass, which is designed to significantly accelerate your learning curve. As with all of our education, it’s completely free to you and gives you everything a paid member of our community gets. That includes our:
We hold nothing back. You can unlock your copy of the FastPass using the link below:
"Should I start with puts or calls?"
Both serve different purposes. Start with the direction that matches your current market view, but understand that the systematic approach works for both bullish and bearish strategies.
"How much capital do I need to start?"
Put options require significantly less capital than short selling. You can begin learning with paper trading, then start with small positions (1-2 contracts) to build experience.
"What if I'm wrong about market direction?"
The beauty of bought options is defined risk. Your maximum loss is the premium paid, making position sizing and risk management straightforward.
Put options transform bearish analysis from “I think this stock will drop” into “I can profit from this decline with precisely defined risk and significantly less capital than traditional short selling.”
The systematic approach we’ve outlined doesn’t guarantee winning trades – no method does. But it dramatically improves your ability to:
Most importantly, you now understand that successful put trading isn’t about predicting the future – it’s about aligning with the market forces that create explosive option moves when conditions are right.
Remember: Every expert put trader started exactly where you are now. The difference between those who succeed and those who struggle isn’t talent or luck – it’s having a systematic approach based on understanding how options markets actually work.
Start with paper trading, focus on the fundamentals, and gradually build your skills with real market conditions. The framework is proven – your job is consistent application and continuous learning.
Risk Disclaimer: Put options trading involves substantial risk and isn’t suitable for all investors. Options can expire worthless, resulting in total loss of premium paid. The examples in this article are for educational purposes and don’t constitute trading advice. Always understand your risk tolerance and consider your financial situation before trading options.