%201.avif)

Two Stock Market Trend Analysis Tools: Why Smart Traders Look Beyond Charts
.png)
Taylor Drake
.png)
December 12,2025
.png)
15mins read
“The trend is your friend” – it’s one of the most repeated phrases in trading. But in reality, knowing that trends matter and actually identifying stock market trends are two very different things.
How many times have you:
✅ Entered a strong-looking trend, only to get chopped up in a sideways market?
✅ Missed a major trend shift because you didn’t recognize the early signals?
✅ Held onto a position too long because you couldn’t tell when the trend was fading?
The problem isn’t understanding that trends exist—it’s knowing how to identify stock market trends accurately and in real time.
That’s where stock market trend analysis tools come in. Instead of relying only on price action and moving averages, imagine having real insights into buying and selling pressure, institutional activity, and options market sentiment.
In this article, you’ll learn how to use two powerful trend analysis tools:
Market Trend Model (MTM) – A data-driven tool that tracks real-time buying/selling pressure.
Intraday Volume Analysis (VOLM) – A tool that deciphers options market activity to predict price trends.
Let’s go:
Most traders rely on indicators like RSI, MACD, and moving averages to determine trends. While useful, these tools share a major flaw:
⚠️ They lag behind price. By the time they signal a trend, the move is often well underway.
⚠️ They don’t reveal the forces moving the market. Price action alone doesn’t tell you whether institutions are truly supporting the move.
⚠️ They give conflicting signals. One indicator might suggest a buy while another warns of a reversal.
The best traders don’t just watch price—they analyze real market flows.
These tools work together to separate real trends from short-term noise.
Example: You see a bullish breakout on a stock chart. But before jumping in, you check the Market Trend Model and VOLM:
What does this mean? The “trend” is likely a false breakout—and you just avoided taking a trade that likely fails in the near future.
Every trader knows the importance of trading with the trend, but most don’t realize that the trend isn’t just about price moving up or down on a chart. Fundamental trends are driven by the cumulative impact of buying and selling in the market. That’s where our Market Trend Model comes in.
At GammaEdge, we’ve developed the Market Trend Model (MTM) to visualize these real market flows in action. At its core is the Cumulative Tick (CT)—think of it as a real-time measure of buying and selling pressure. Every time a transaction pushes the price up, that’s an uptick. Every time it pushes the price down, that’s a downtick. The CT tracks all these moves throughout the session and creates a time series, as shown in the graphic below.

The MTM then layers three powerful perspectives on these market flows:
1. Real-Time Momentum (White Line)
2. Short-Term Trend (White Moving Averages – referred to command as “railroad tracks”)
3. Long-Term Trend (Rainbow Ribbon)
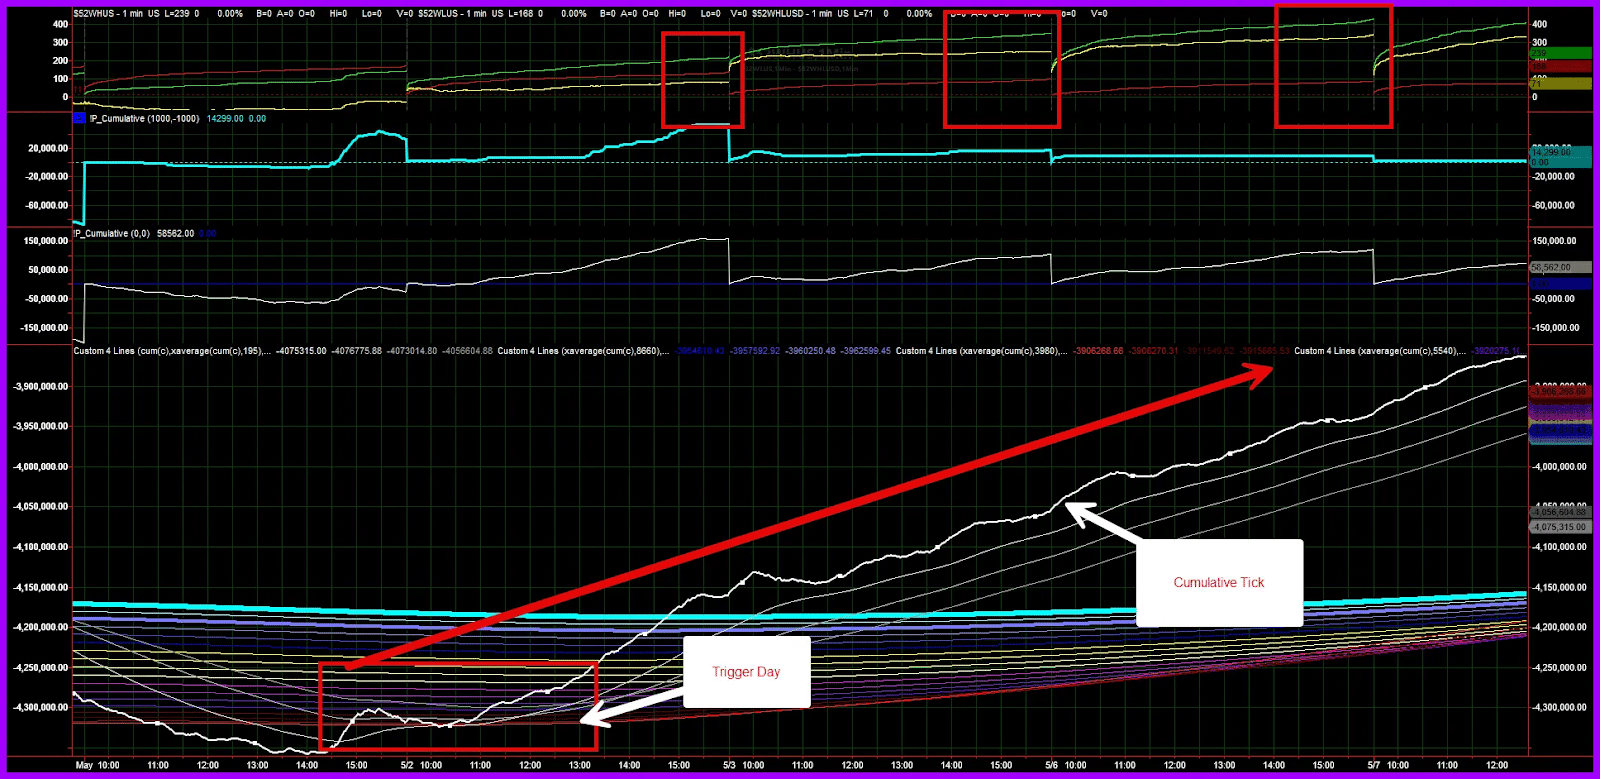
Analyzing last month’s market action, let’s see how the Market Trend Model works in practice. While there are many components to the MTM, we’ll focus on three key elements:
Side note: the thick cyan line below is the “filtered tick.” This is our measurement of institution activity, as this line only moves when large/significant buying or selling occurs in the market. Specifically, +/—1,000 ticks is the general benchmark used by the market as a whole.
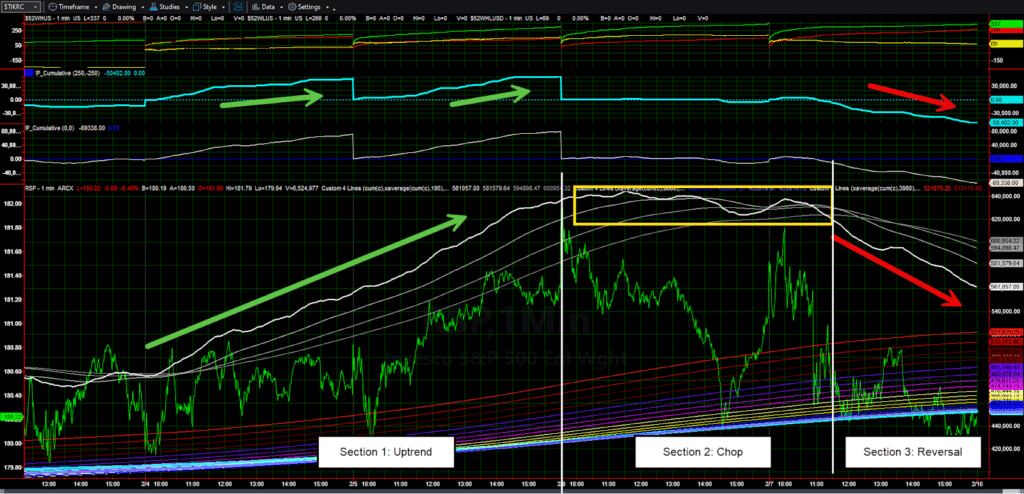
The week broke down into three distinct phases that perfectly showcase why the MTM is so valuable:
Key Trading Lesson: Rather than hoping for a bounce on Friday, the MTM gave you concrete evidence that real selling pressure had entered the market. As we tell our community: “Hope is not a risk management strategy!”
What’s Next? While the longer-term trend remains up (notice the rainbow ribbon’s upward slope), we’re in a short-term pullback. For a resumption of the uptrend, we want to see:
Until we see these signals align, swing traders are better served staying patient and waiting for clearer conditions.
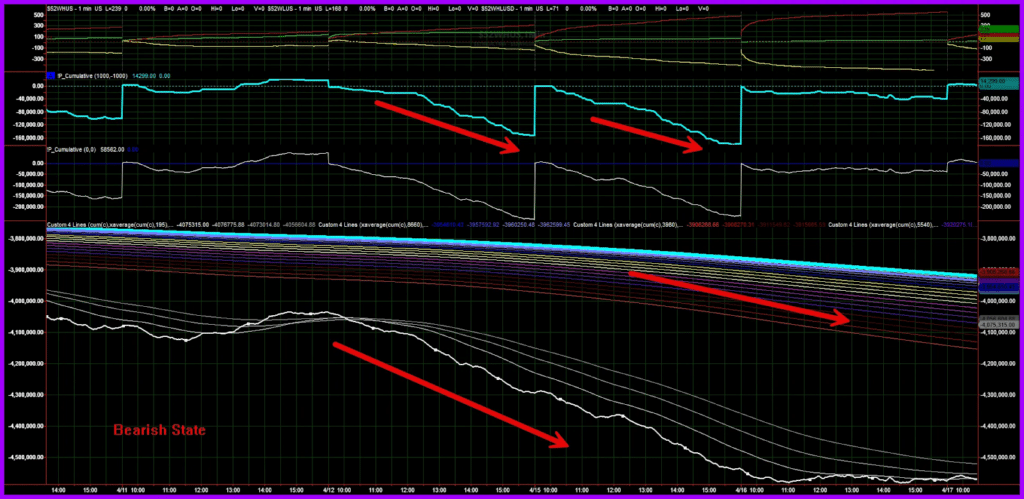
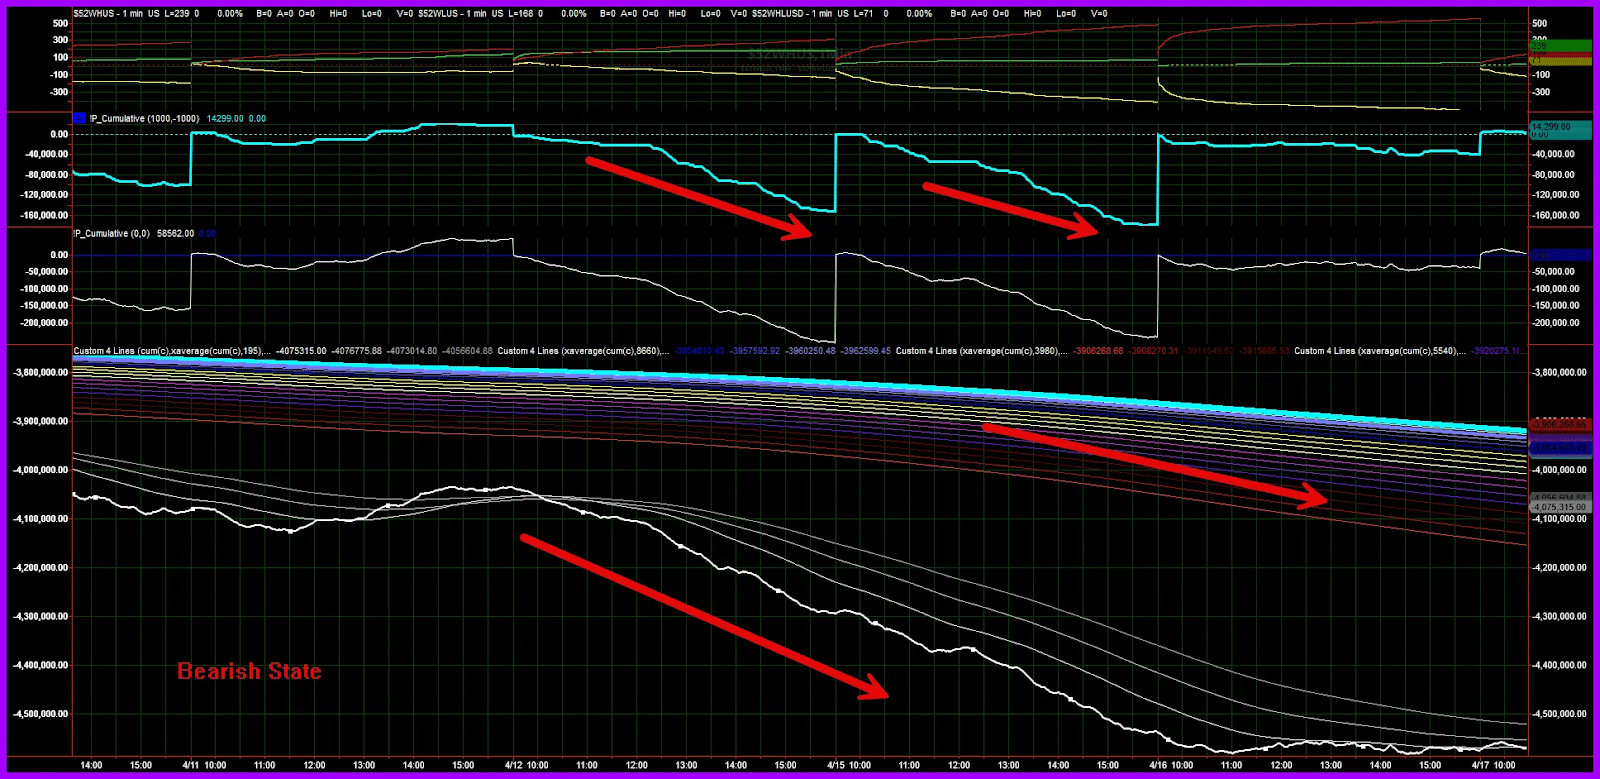
And before we move on, we wanted to provide you with what a completely bearish state looks like. Here we can see all trends are pointing lower, with significant selling taking place! For us to get interested back to the long side, it’d start with a reversal of the CT. Remember, not all CT reversals lead to an uptrend, but all uptrends start with a CT reversal.
While the Market Trend Model helps us understand the broader market flows, there’s another critical piece: real-time options market activity. After all, in today’s markets, options often drive stock price movement, not vice versa. We’d be remiss not to have an understanding of these flows as well, and we’ve got you covered!
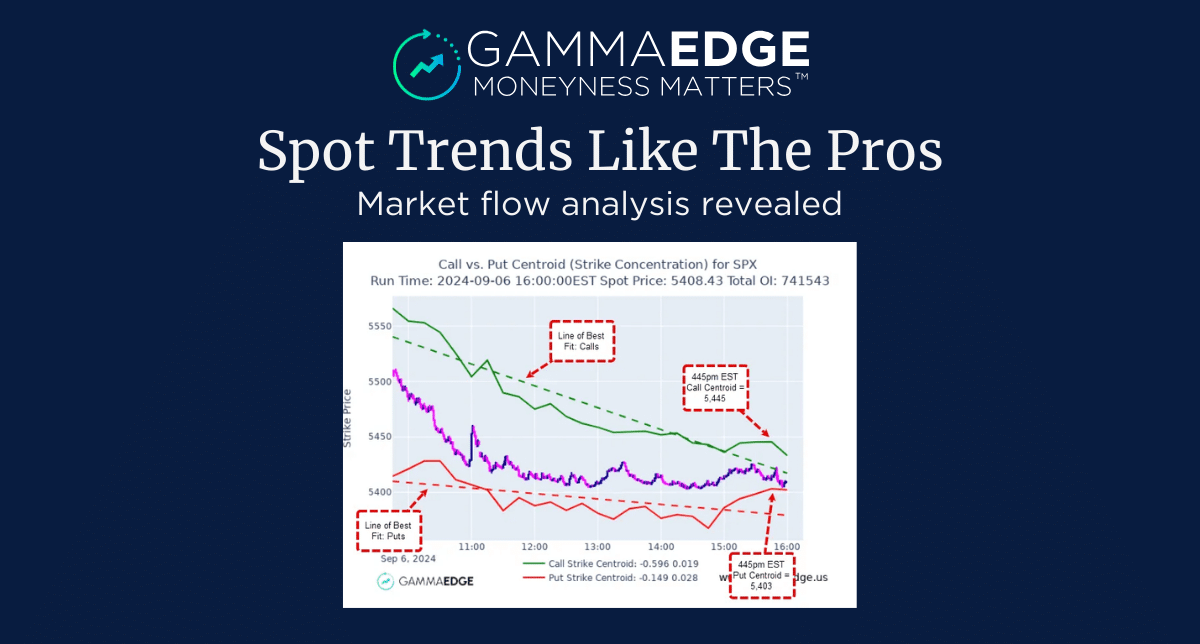
While the Market Trend Model shows broad market flows, today’s markets are heavily influenced by options activity. That’s where our VOLM (Volume Momentum) command comes in—think of it as “following the money” in real-time options flow.
VOLM tracks two critical elements throughout the trading session:
These centroids are like centers of gravity for options activity, recalculated every 5 minutes. The dashed “lines of best fit” show the trending direction of this activity – giving us potential “goalposts” for where the price might settle if current patterns continue.
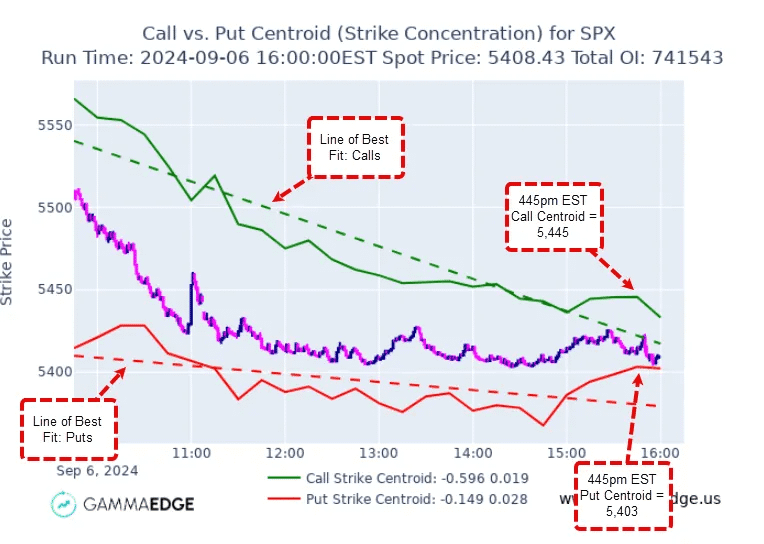
VOLM helps us quickly identify two key market states:
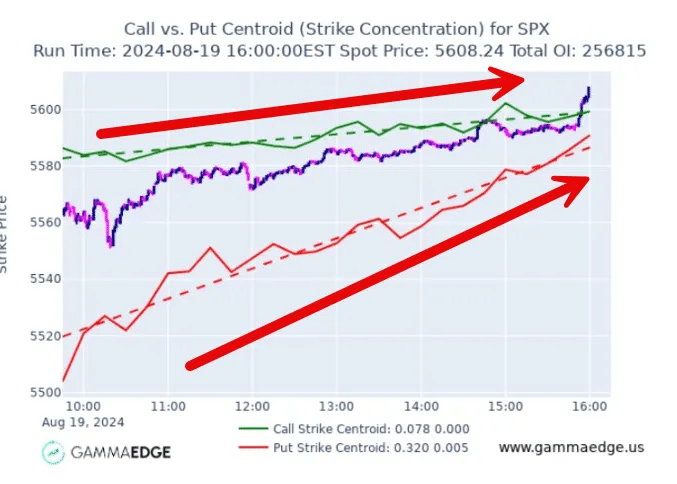
1. Trending Days
2. Choppy Days
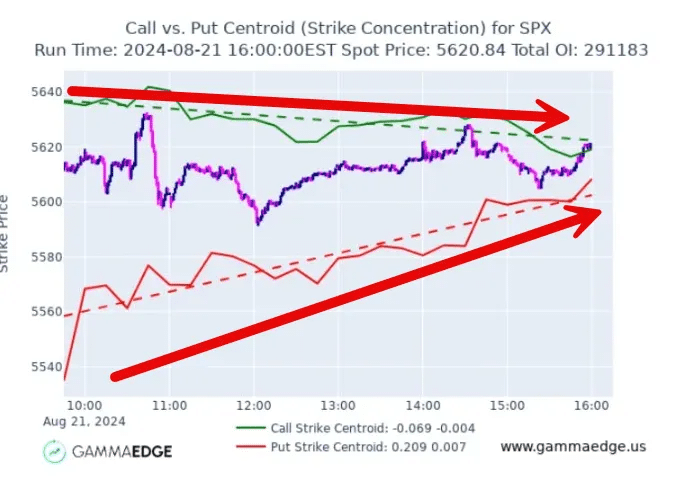
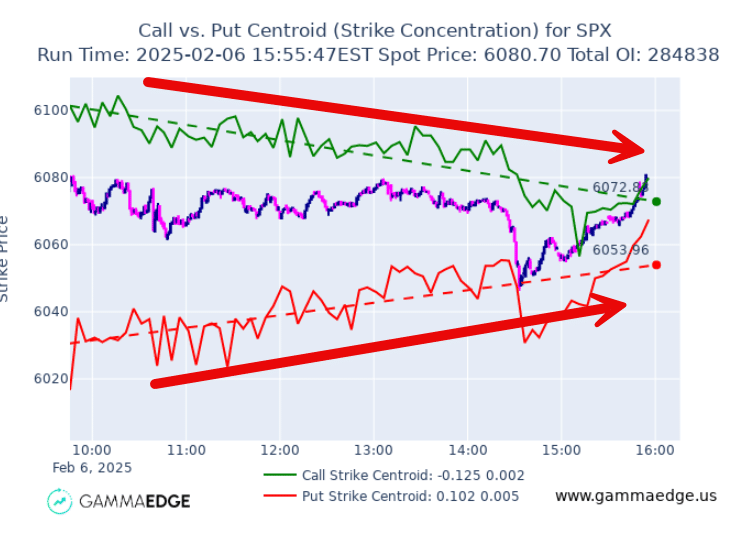
Here’s how you could have used VOLM (one of our stock market trend analysis tools) to catch last month’s market move (that we already covered using the MTM above):
Notice how the call and put centroids converge in opposite directions on the day.
We’ve covered a lot today. Here’s how you can use our two stock market trend analysis tools to capture real trends, and avoid false ones:
If you’re a swing trader — don’t ignore the flow of intraday options! Remember that every swing trade starts as a day trade, and relying on our two stock market trend analysis tools (MTM and VOLM) will help you validate your directional bias from day one, keeping you out of trades that look good on charts but lack support from underlying options.
Pro Tip: When both tools align, trend confirmation is strongest—giving you a high-probability trade setup.
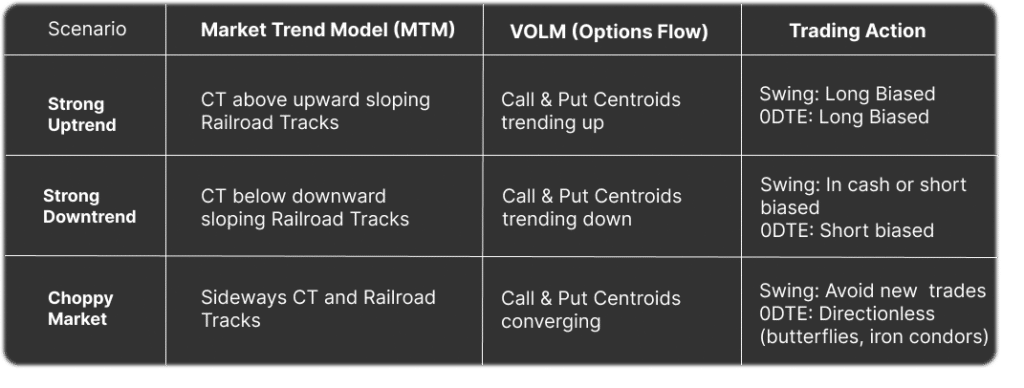
Let’s review the Key States for both the Market Trend Model (MTM) and VOLM one more time…
Bullish State
Bearish State
Bullish Structure
Bearish Structure
Choppy Conditions
Pro Tip: The most potent signals come when both tools align. When you see MTM’s Cumulative Tick trending with Railroad Tracks AND VOLM centroids confirming that direction – that’s your highest probability setup.
The phrase “the trend is your friend” is only true if you can accurately identify stock market trends before they fully develop. Traditional chart patterns aren’t enough—you need data-backed stock market trend analysis tools like:
✅ Market Trend Model (MTM) – To track real market flows.
✅ Intraday Volume Analysis (VOLM) – To analyze options market positioning.
These tools give you a real edge, helping you:
✅ Identify strong trends early.
✅ Avoid fake breakouts.
✅ Spot reversals before price reacts.
Want to dive deeper? Explore GammaEdge’s Complete Framework to learn how to implement these trend analysis tools in your daily trading.
Or, if you’re ready to get started with GammaEdge, click here.
We get it – the last thing you need is another complicated indicator. But here’s the key difference: the Market Trend Model and VOLM aren’t traditional stock market trend analysis tools – they’re windows into actual market activity.
Instead of adding complexity, these tools simplify your decision-making by showing you:
Real buying and selling flows (not just price patterns)
Actual options positioning (not just technical signals)
Institutional activity through Filtered Tick
Think of them as an X-ray vision of market structure rather than another layer of technical analysis.
Remember this crucial point: all trades start as day trades. Even if you plan to hold for weeks, that first day matters enormously.
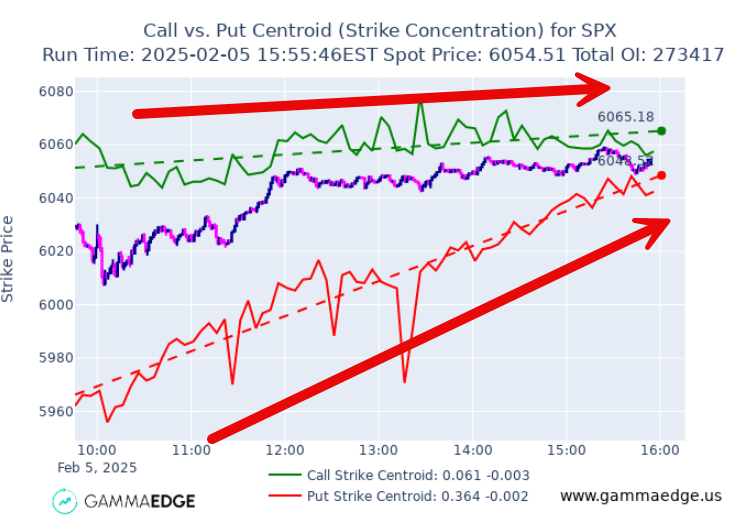
Consider last February 5th’s action:
Price formed what looked like a bullish hammer on the daily chart
But MTM showed weakening flows and no institutional buying
VOLM revealed choppy, directionless options activity
This early warning helped avoid entering right before Friday’s decline
These tools help you avoid starting swing trades against major market flows – often the difference between winning and losing positions.
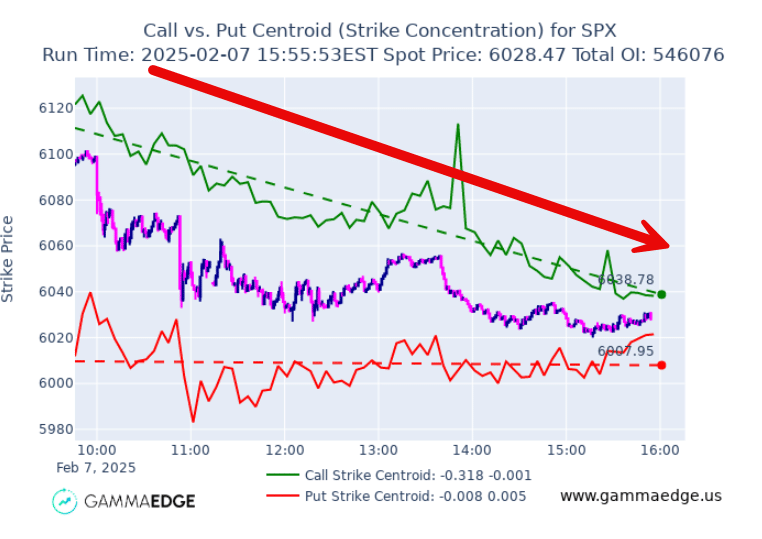
These stock market trend analysis tools excel at providing early warnings before major moves develop. Take February 7th’s reversal:
The real value isn’t just catching moves – it’s preventing bad trades by showing you when conditions don’t support your bias.
Remember: The goal isn’t catching every move, but rather identifying high-probability setups and avoiding low-probability ones (money saved = money earned). These tools excel at both.