%201.avif)

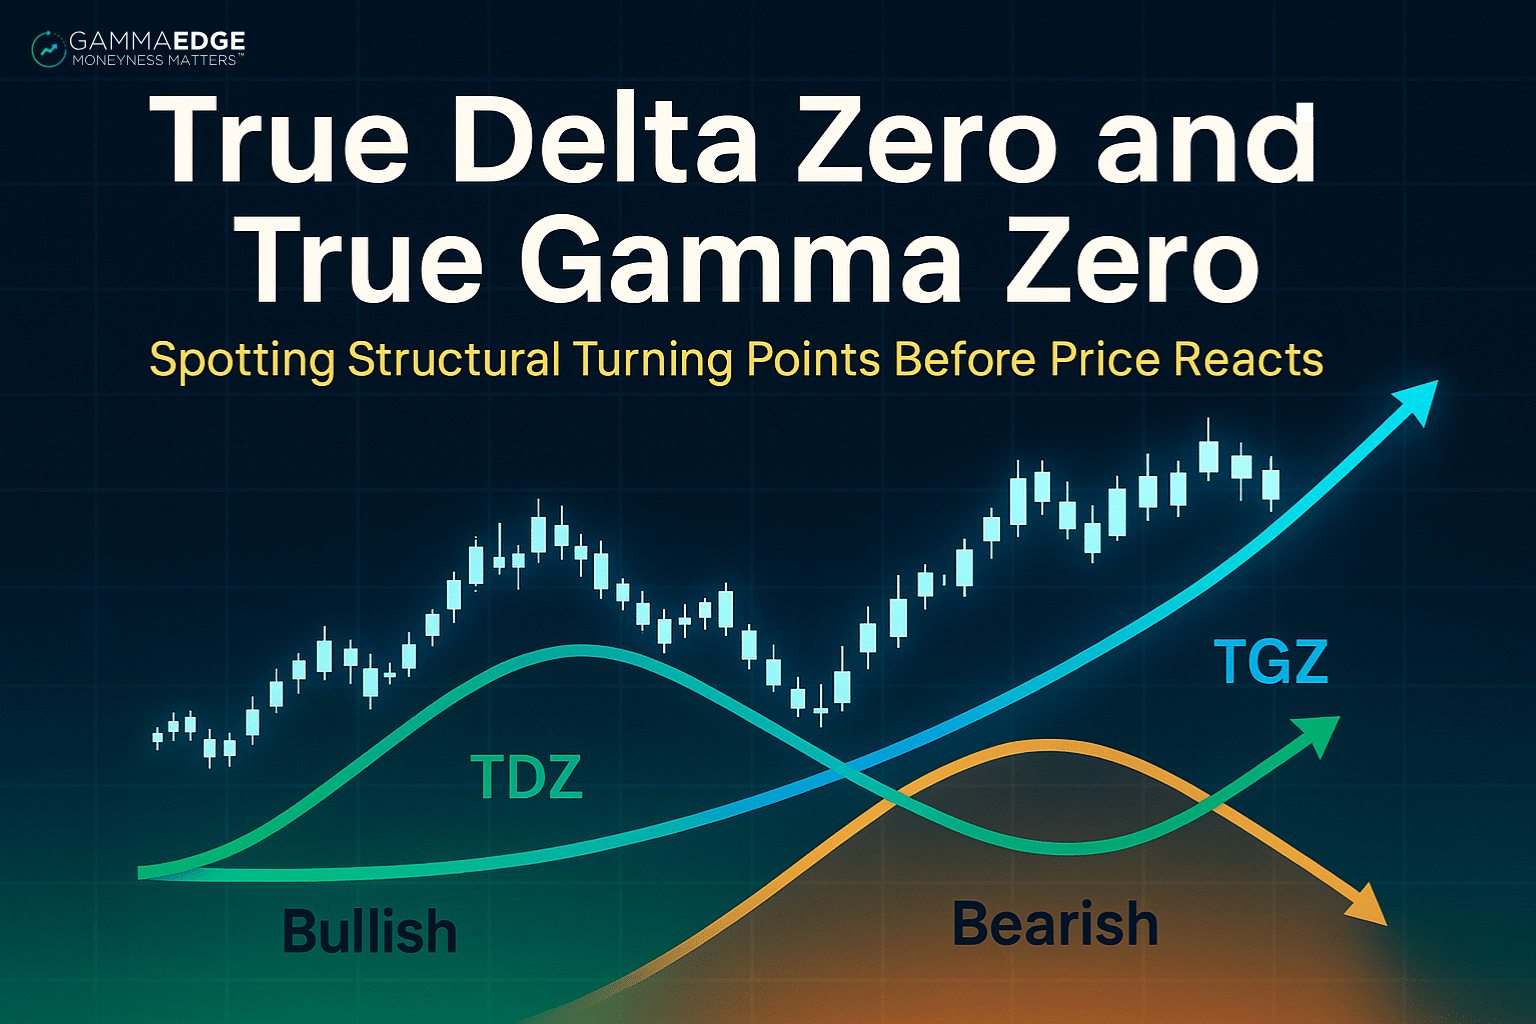
True Delta Zero and True Gamma Zero: Market Structure Indicators That Reveal When Big Moves Are Coming
.png)
Taylor Drake
.png)
December 12,2025
.png)
15mins read
Have you ever wondered when the market is about to make its next big move?
Yes, it’s great that we have charts, indicators, and technical patterns – but that stuff is only surface level. What if there’s a way to see the market’s underlying balance—or imbalance—that most people completely miss?
Today we’re diving into two powerful sentiment indicators that can help you understand when the market is primed for a major shift: true delta zero and true gamma zero.
Here’s what most traders miss: whether you’re trading stocks, futures, or options, today’s market is driven by options positioning. With the explosion of options trading across all participant types, dealers are managing massive exposure that directly impacts price movement.
If you’re only looking at traditional indicators, you’re missing a key driver of market trends (or lack thereof).
Think about it – dealers are constantly hedging risk across:
While you’re analyzing price charts and momentum indicators, there’s an entire layer of structural forces operating beneath the surface. That’s where true delta zero and true gamma zero indicators come
Think of these as the market’s structural balance points that reveal dealer positioning across the entire options complex.
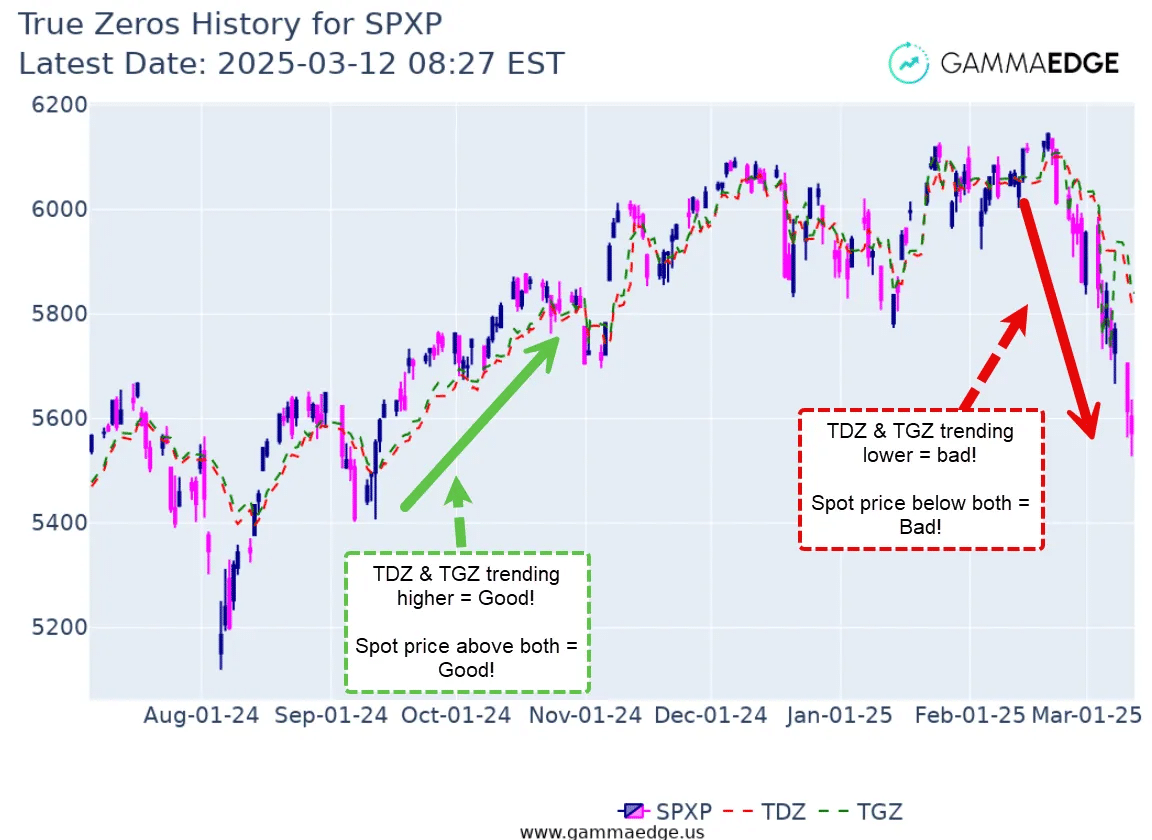
True Delta Zero (TDZ) is the theoretical balance point where put delta and call delta are perfectly balanced across the entire options complex.
Key characteristics:
True Gamma Zero (TGZ) represents the theoretical balance point where put gamma and call gamma are exactly balanced across the complete options structure.
Key characteristics:
When these delta and gamma zero levels start shifting from downtrends to uptrends, it suggests calls are increasing their influence within the options complex—exactly what you want to see for building bullish momentum.
Instead of getting lost in the complexity of individual options positions, true delta zero and true gamma zero give you a bird’s-eye view of structural positioning.
Bullish structural signals:
Bearish structural signals:
Warning signals:
Here’s where true delta zero and true gamma zero analysis gets interesting. It’s not just about where these levels are—it’s about how they’re moving.
Bullish slope patterns:
Bearish slope patterns:
Divergence patterns:
One of the most powerful applications of true delta zero and true gamma zero analysis is identifying when price interacts with these structural levels.
What to watch for:
Key observations:
Powerful setup conditions:
True delta zero and true gamma zero provide a unique window into market structure that most traders completely ignore. While they won’t tell you exactly where the market is going, they reveal where the structural foundation is strongest or weakest, and when conditions may be ripe for significant moves.
The competitive advantage:
Implementation success factors:
Ready to add this powerful structural perspective to your trading toolkit? Understanding true delta zero and true gamma zero gives you insight into the forces that move markets—forces that traditional technical analysis simply can’t reveal.