%201.avif)

Trading SPX 0DTE Butterfly Strategies: Your Ultimate Guide
.png)
Taylor Drake
.png)
December 12,2025
.png)
15mins read
Most traders have been taught that making money in the markets requires catching big moves. You’ve probably heard it yourself – “the trend is your friend” or “buy low, sell high.”
These mantras aren’t wrong, but they miss an important reality of market behavior: stocks spend a lot of time moving sideways.
While many traders step aside during choppy price action (and rightly so), those who recognize these range-bound conditions as opportunities can generate consistent profits.
1) Finding The SPX 0DTE Butterfly Setup
First, we’ll show you how to use our VolM (Volume Momentum) tool to identify when markets are likely to remain range-bound. This tool helps us understand:
This is a key first step to profitably trading SPX 0DTE Butterfly strategies.
2) Capitalizing on Opportunity
Next, we’ll explore how to profit from these conditions using a butterfly spread – an options strategy specifically designed to thrive when stocks trade within a defined range. Think of it like placing guardrails around where you expect the stock to trade.
When price stays within those rails, you profit and the beauty of combining these two approaches is that our VolM analysis helps inform exactly where to place those guardrails.
By the end of this article, you’ll understand how to spot these setups and position yourself to profit from them.
Let’s start by understanding how a SPX 0DTE butterfly spread works, then we’ll look at how VolM helps us find the perfect conditions to use it.
A butterfly spread is a powerful strategy that can help you profit when you expect a stock to stay within a specific range. But rather than just telling you it’s powerful, let’s break down exactly how it works and why it’s particularly effective in choppy markets.
Think of a butterfly spread as placing guardrails around where you expect a stock to trade. The setup involves three simple parts:
Your maximum profit occurs when the stock finishes right at your middle strike price – where you sold the two options – and your risk is limited to what you paid (i.e., premium) to enter the trade.
For example, if you think SPX will settle around 4515, you might:

The beauty of a butterfly is that it tells you exactly what you want to see happen. You’re not hoping for a big move up or down – you simply want the stock to settle near your middle strike.
This is where our VolM analysis becomes crucial.
By using VolM to identify when SPX is moving sideways with clear boundaries, we can place our SPX 0DTE butterfly right in the middle of where the market is most likely to settle – rather than guessing, we’re using market-generated data to inform our target price.
Remember, in choppy markets, stocks tend to stay within defined ranges. Combining this natural market behavior with a strategy designed to profit from it creates a potent edge.
Our VolM tool helps take the guesswork out of identifying range-bound conditions. Rather than hoping a stock will settle near your target price, VolM shows us where the market is actually focusing its activity.
VolM tracks the center of mass – speculation – for both call and put option activity throughout the trading day. It plots this activity on 5-minute intervals (solid lines in the figure below), creating lines of best fit (dashed lines below) that show us where options traders are focusing their attention.
When these lines start trending sideways and the rate of change (of the dashed lines) approaches zero, we have our first clue that the market is settling into a range. This is exactly what we want to see before placing a butterfly spread.
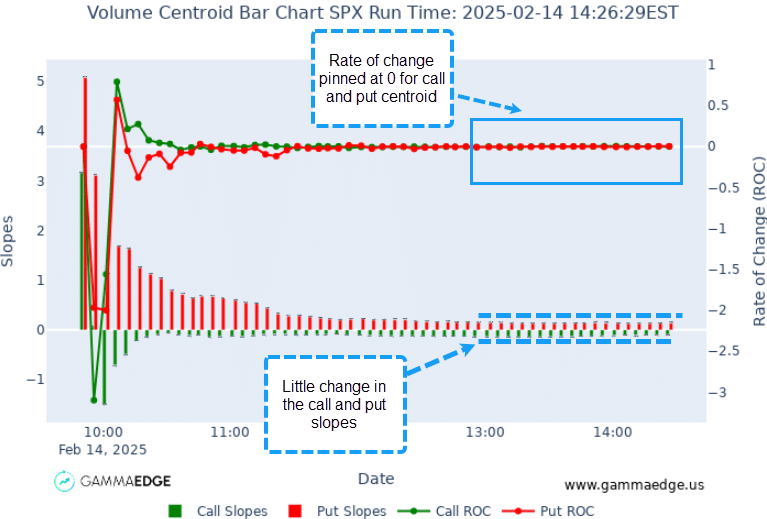
In addition to the VolM command, we also leverage our CenTab command, which provides critical measurements of the VolM lines of best fit. This gives us even more precision in identifying ideal butterfly setups:
The key insight is that while the lines may have positive or negative slopes, those slopes aren’t changing much (hence the rate of change near 0). This stability indicates a high-probability range-bound market – perfect for our butterfly strategy.
Let’s break down what we look for:
The sweet spot for entering these trades typically comes in the afternoon session, after the London close. By this time, the market has usually established its daily range, and VolM/CenTab can give us a clearer picture of where spot price is likely to settle.
Now that you understand how a butterfly spread works and how VolM (and CenTab) helps us find the right conditions, let’s look at a real example that brought these concepts together…
Let’s walk through an actual trade setup from March 18th, 2025, showing you exactly what the conditions looked like when we spotted the opportunity and how it played out.
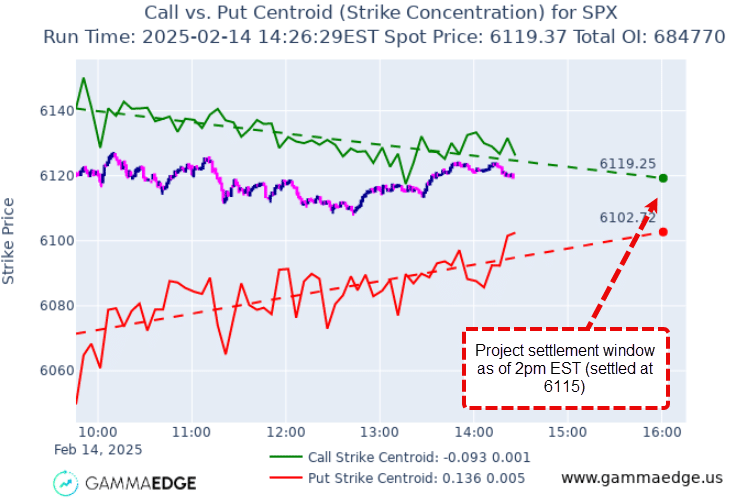
By early afternoon, our VolM and CenTab analysis showed a classic range-bound structure perfect for the makings of a butterfly trade:
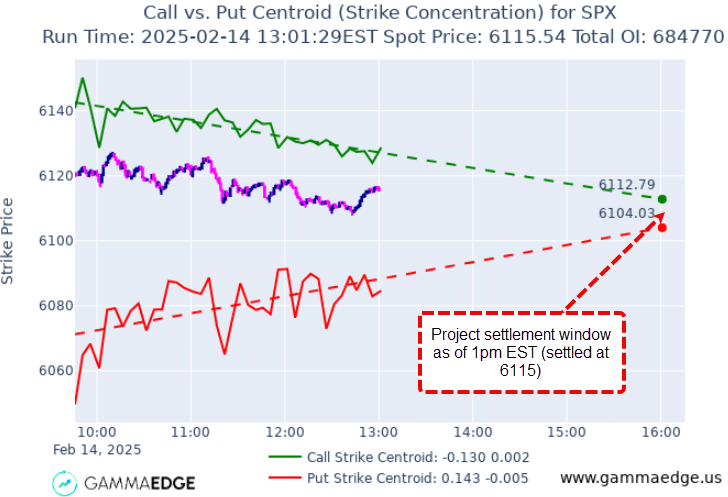
This combination of factors strongly suggested the market was settling into a defined range. Looking at our lines of best fit at 1PM EST, we could identify clear boundaries:
With these parameters established and rates of change near zero, we had our ideal setup for a butterfly spread targeting the 6105 strike. The projected settlement window (shown in the VolM chart) indicated this area was the most likely destination for price by the end of the session (as of 1pm EST).
What made this setup particularly compelling was the stability in both charts – the consistent slopes combined with near-zero rates of change had persisted for over an hour, giving us high confidence in the projected range.
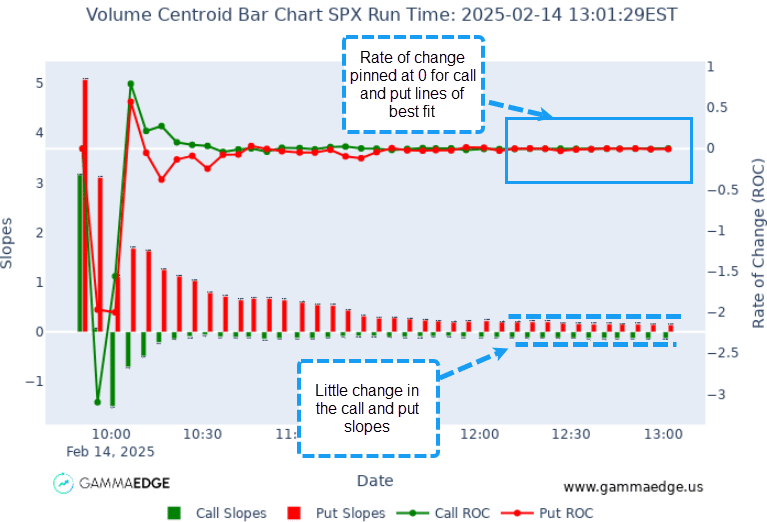
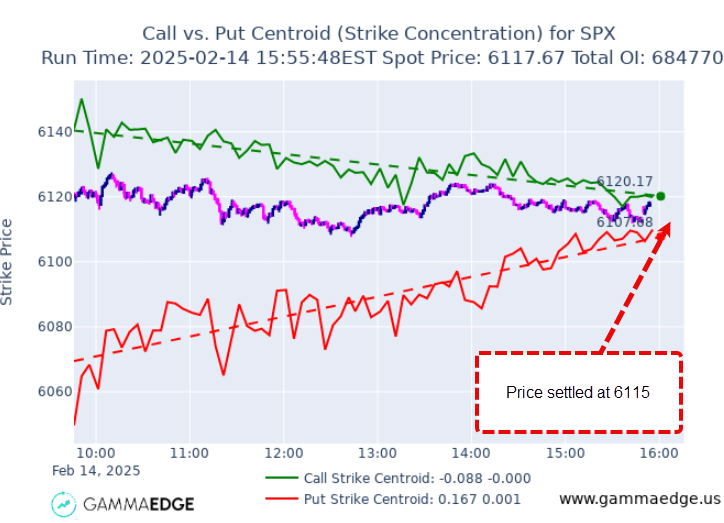
Moving forward an hour, our tools continued to validate our range-bound thesis:
Looking at the updated VolM chart, we can see the projected settlement window now centered around 6110-6115, slightly higher than our initial assessment but still well within range for a properly structured butterfly spread.
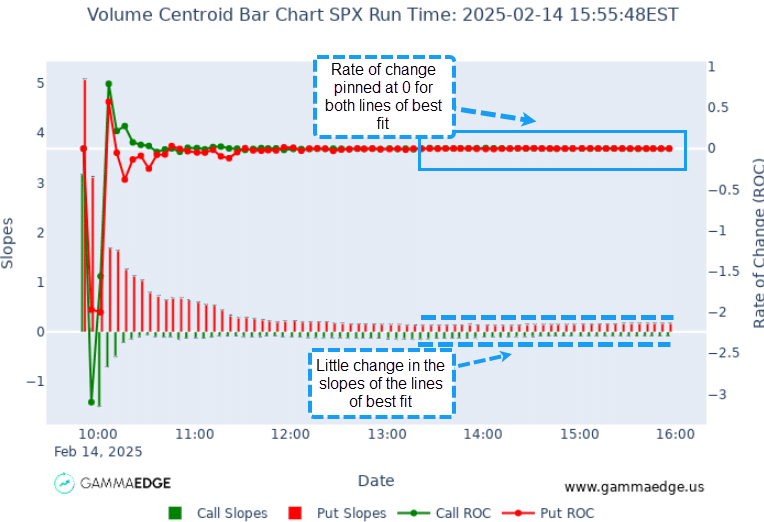
The CenTab chart reinforces this stability – notice how the top portion shows both call and put rates of change remaining flat near the zero line for over two hours. This persistence of near-zero rates of change is exactly what we want to see for a high-probability butterfly setup.
While this slight shift might have required minor adjustments to your trade, a butterfly centered at 6110 would still be well-positioned to capture the likely settlement range. This demonstrates why proper position sizing and risk management are crucial – markets rarely follow our projections with perfect precision, but a well-structured trade accounts for these minor variations.
NOTE: In the accompanying video below, we explore a key strategy refinement – using wider butterflies (15 or 20 points wide instead of traditional 5-10 point spreads). At 2pm EST, the projected range between our lines of best fit typically spans 30-40 points. Rather than trying to pinpoint the exact settlement price, a wider butterfly allows you to cover more of this range, significantly improving your probability of success. This approach means you might open multiple butterfly positions across the projected settlement zone, creating a “constellation” effect that captures price movement as it approaches finality. While wider butterflies require more capital, they provide much better coverage against the natural imprecision in market projections.
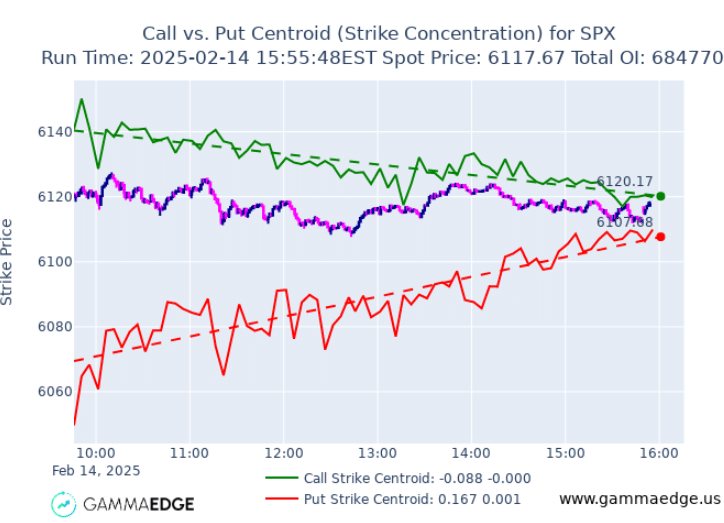
Looking at the final VolM and CenTab charts at market close, we can see why this setup was so powerful:
What’s remarkable is the consistency we observed throughout the day. From our initial analysis at 1:00 PM through the closing bell, the market structure remained stable – exactly what our butterfly strategy requires.
Notice how the spot price line on the VolM chart fluctuated throughout the day, yet ultimately settled at 6115, almost perfectly between our projected boundaries. This wasn’t just luck – it was market structure at work. The volume patterns showed us where options traders focused their activity, creating a natural gravitational pull toward this price level.
This example demonstrates why combining VolM and CenTab analysis with butterfly spreads creates such a powerful edge. We’re not just guessing where the market might go – we’re using actual market-generated data to identify high-probability outcomes.
To make the most of this strategy, remember:
While this article gives you the foundation, we’ve created a comprehensive video that dives deeper into: