%201.avif)

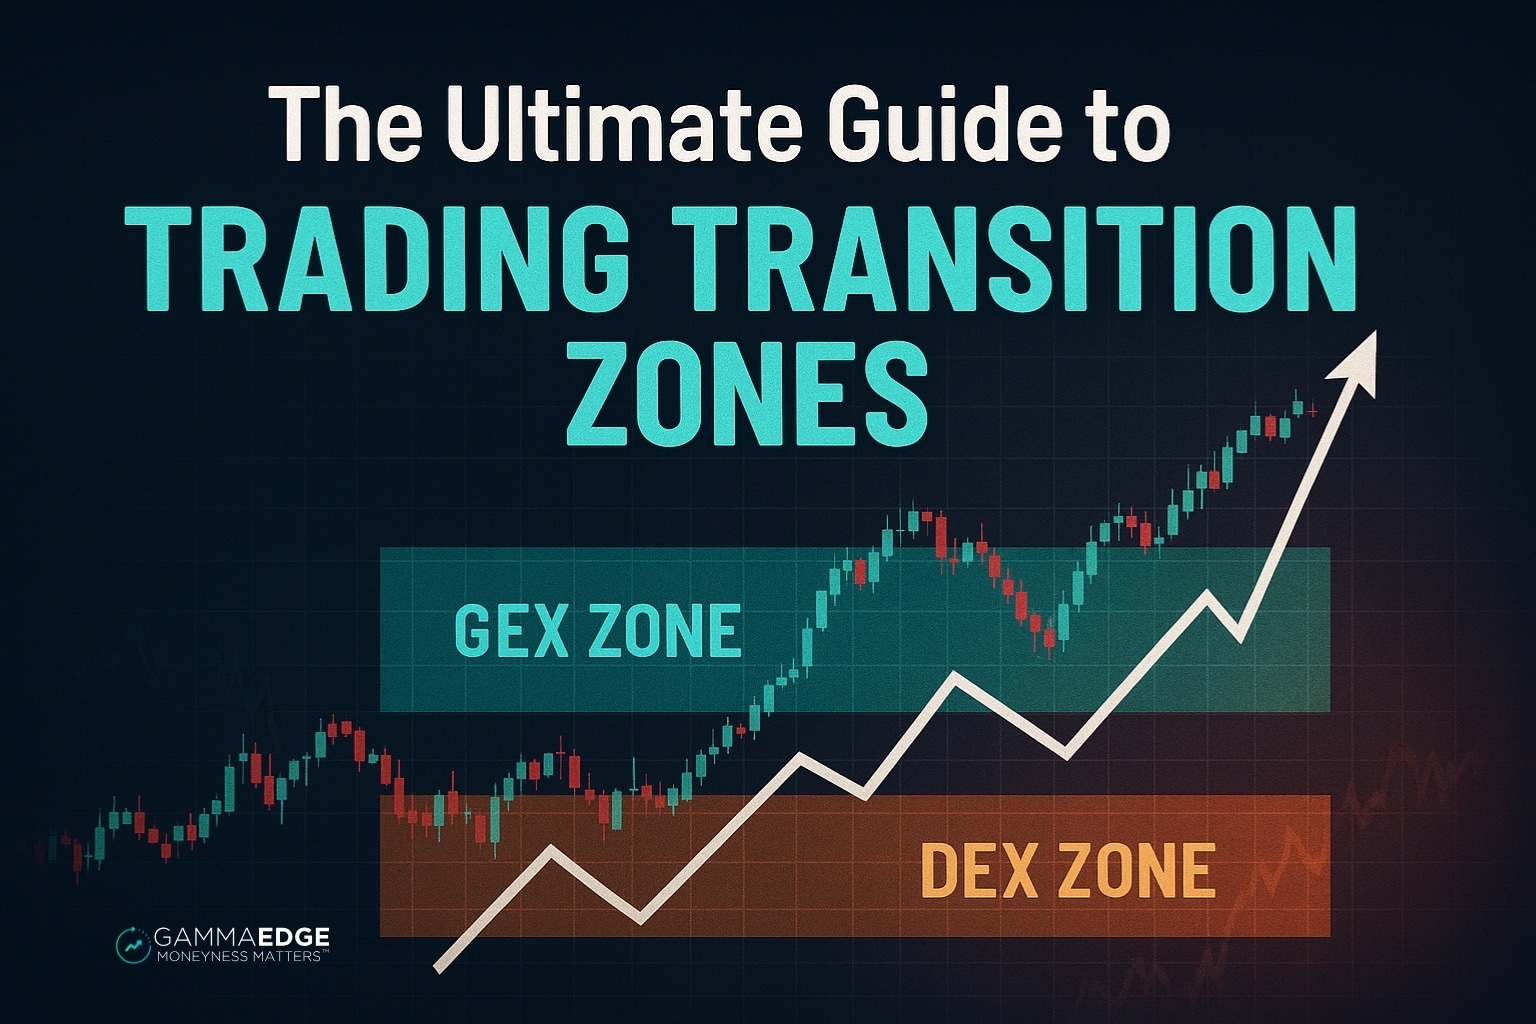
The Ultimate Guide To Trading Transition Zones: How To Read Market Structure For Consistent Profits
.png)
Taylor Drake
.png)
December 12,2025
.png)
15mins read
Your trade is cruising perfectly. Price breaks through resistance, momentum is building, and you’re sitting on solid gains. Then out of nowhere – with no technical level in sight – price suddenly reverses and wipes out your profits.
Sound familiar?
Here’s what’s actually happening: You’re hitting structural transition zones created by options positioning that don’t show up on traditional charts. These aren’t random reversals – they’re mathematically defined levels where options forces push price around.
The Reality:
Options volume now regularly exceeds stock volume in major indices. This isn’t just a statistic – both retail and institutional traders are driving explosive options growth, creating structural forces that control when price accelerates, when it chops, and when it reverses.
Most traders are completely blind to these pressure points.
While others wonder why their perfect setups fail, you can learn to see these structural forces before they impact price. Through analyzing options positioning, we’ve identified three critical transition zones that reveal exactly where to expect:
Master these three zones and you’ll understand why those “mysterious” reversals happen and how to position yourself accordingly.
By the end of this article, you’ll know exactly how to identify all three zones and use them to read the structural forces that actually drive price movement.
And here’s a video walkthrough of today’s content if you’d prefer watching rather than reading:
The numbers tell a compelling story. Over the last decade, the U.S. options market has experienced explosive growth, with trading volumes significantly outpacing futures market expansion.
This surge creates new market dynamics:
When options volume dominates, price action increasingly follows options positioning rather than traditional technical patterns. Those clean support and resistance levels that used to hold? They’re meaningless if there’s massive gamma exposure sitting right above them.
Your competitive advantage: While others analyze outdated patterns, you’ll understand where market makers must hedge and where gamma creates acceleration points.
Trading without understanding these structural forces means you’re essentially flying blind to the mechanical pressures that drive short-term price action.
But when you can see where market makers must hedge, where gamma creates acceleration, and where positioning builds pressure? That’s how you stack the odds in your favor.
When you understand where the big positioning sits, you can anticipate the mechanical forces and transition zones that will push price around.
This isn’t about predicting the future. It’s about understanding the options market structure that create those “mysterious” reversals and accelerations.
Ready to dive in? Let’s start with the first transition zone that controls how explosive your moves will be.
The GEX (Gamma Exposure) transition zone functions as your early warning system for explosive price moves. Think of it as a “neutral zone” where options positioning minimally influences price direction.
Inside the GEX transition zone, neither calls nor puts have enough control to push price decisively in either direction. This creates the choppy, sideways action that frustrates trend-following strategies.
Two key levels define every GEX zone:
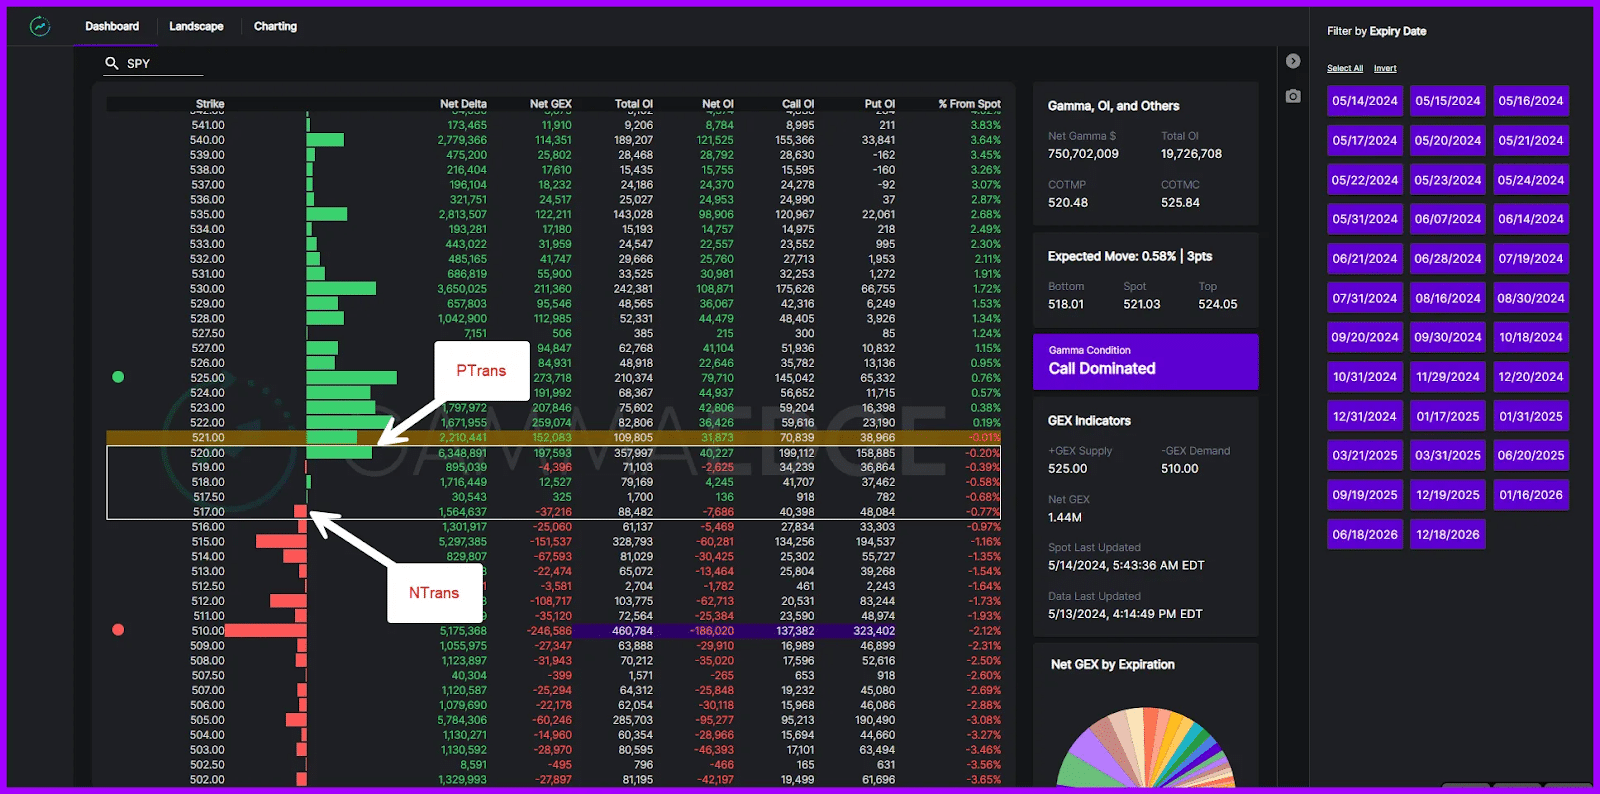
Here’s the key insight: Market makers face minimal directional risk when price stays within transition zones. But the moment price breaks above PTrans, market makers face rapidly growing delta exposure due to gamma effects.
This forces aggressive hedging through buying, which accelerates the move higher. The exact mechanics work in reverse below NTrans—aggressive hedging accelerates moves lower.
PTrans and NTrans are NOT traditional support and resistance levels. These are acceleration triggers. We expect price to break through them and continue, not bounce off them.
When you see price trading between these levels, expect choppy action. Once price breaks outside the zone, expect acceleration in that direction.
While GEX shows you where prices might accelerate, DEX (Delta Exposure) zones reveal which direction the market wants to go. This is your sentiment compass based on actual positioning, not just short-term speculation.
DEX transition zones cut through market noise to show genuine directional bias. Unlike GEX, which can shift dramatically as price moves, DEX provides a stable view of market structure.
The zones use the same PTrans/NTrans framework, but focus on the “Net Open Interest” distribution rather than gamma exposure:
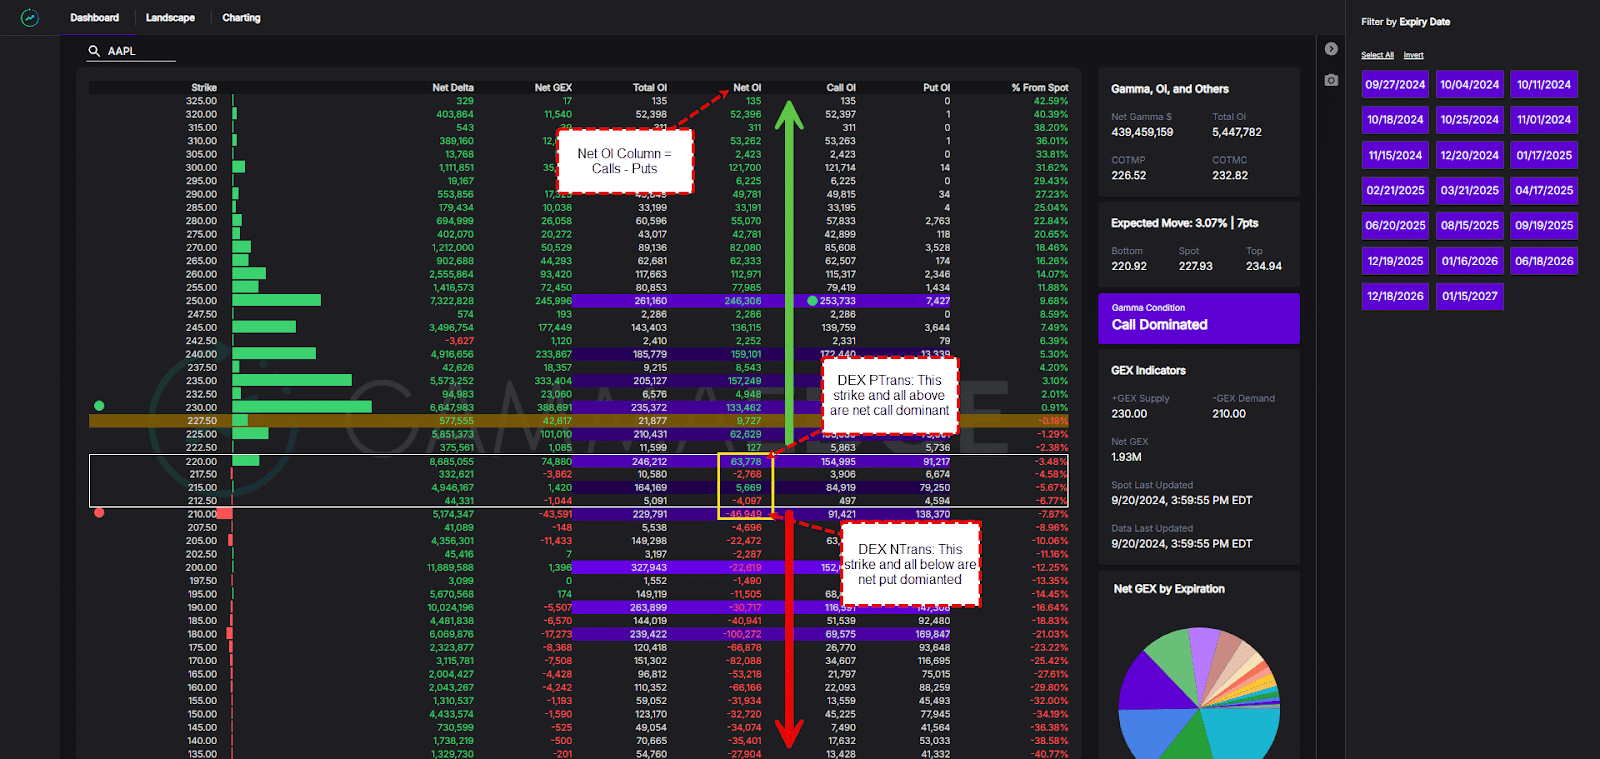
When you break above DEX PTrans, all strikes above that point are call-dominated. Break below DEX NTrans, and puts take control below that level.
The area between DEX zones often exhibits choppy price action due to back-and-forth between call and put dominance. This causes market maker exposure to shift within tight ranges, creating the sideways grind that kills directional strategies.
DEX provides more stability than GEX because it’s less sensitive to current price movement. Use DEX as your primary decision-maker for trade direction and risk management—it shows the underlying structural bias that persists despite short-term fluctuations.
Key insight: When GEX and DEX zones align tightly, you have high-confidence structure. When they’re far apart, expect uncertainty and wider ranges.
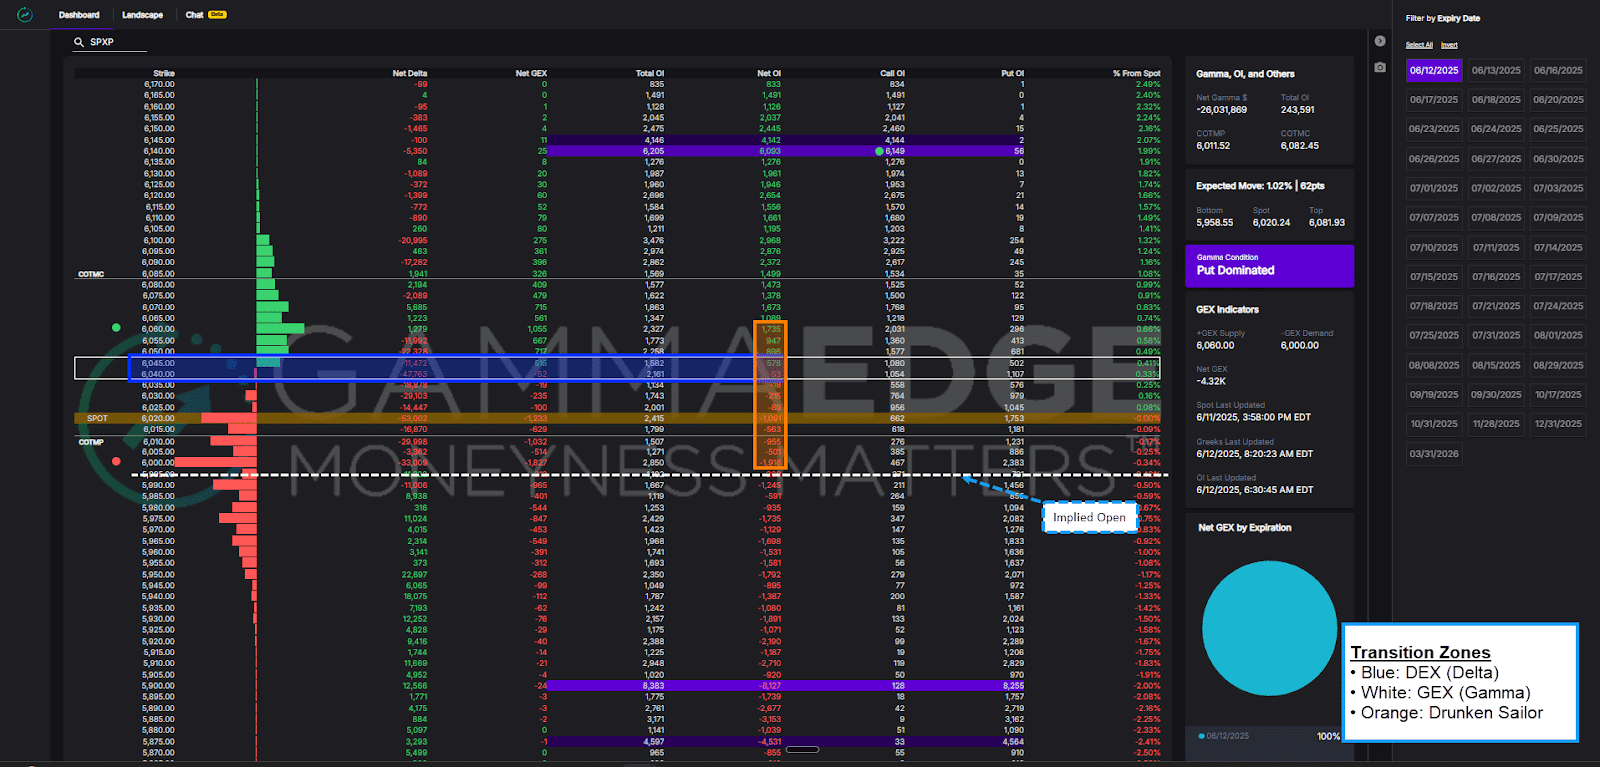
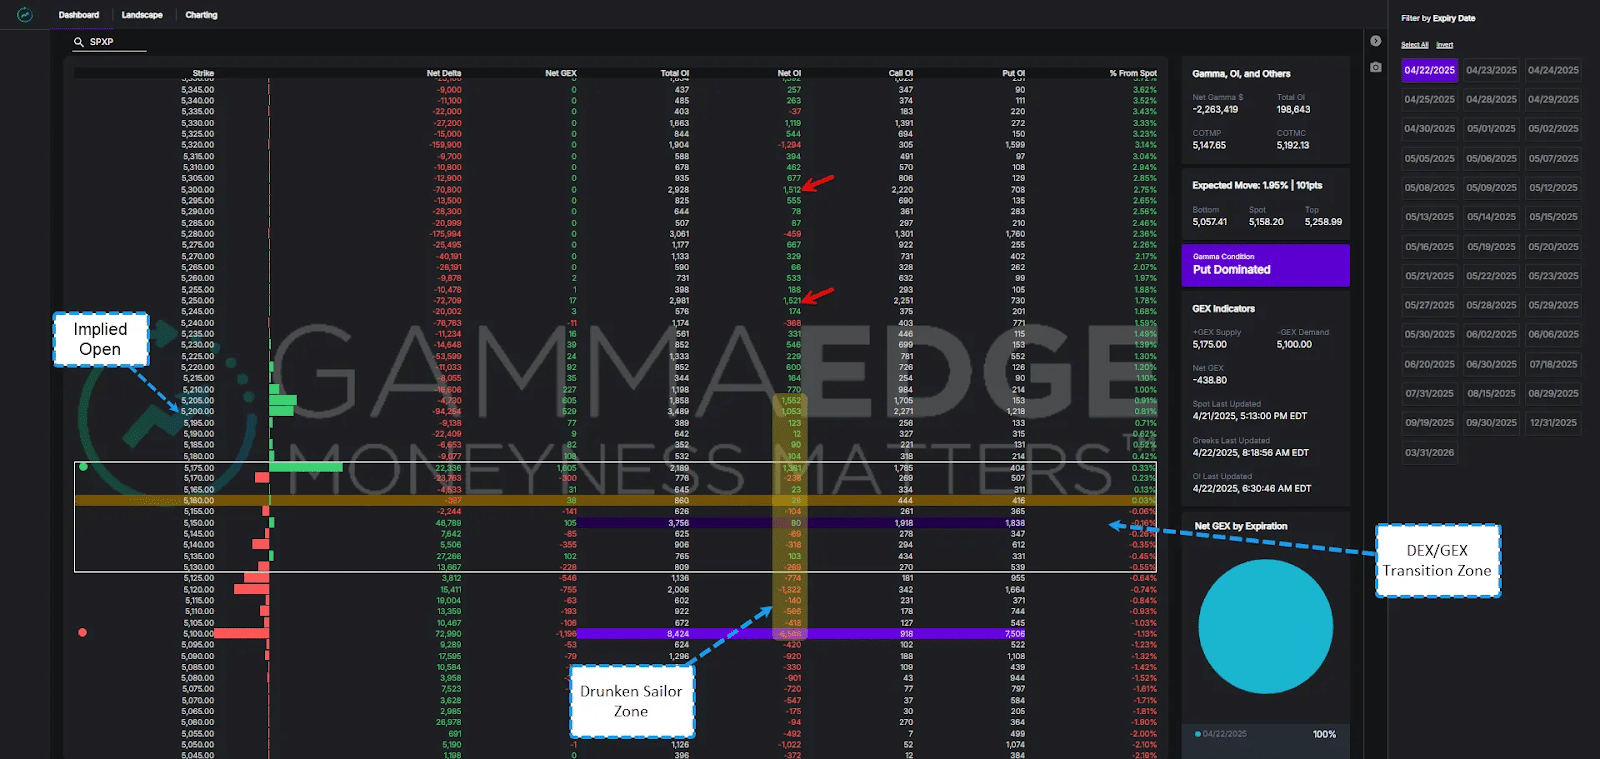
The name says it all. Like a drunken sailor wandering unpredictably down the dock, price can stagger back and forth within certain boundaries after breaking out of the GEX and DEX zones. This erratic movement frustrates traders who expect clean, directional moves, but it’s not random.
The Drunken Sailor Range is unique to SPX 0DTE trading and focuses on where price tends to meander. While GEX and DEX show you the initial breakout zones, Drunken Sailor reveals where that breakout might lose steam or find renewed energy.
How It’s Different
Unlike GEX and DEX, which focus on dominance (calls vs puts), Drunken Sailor analyzes the Net Open Interest distribution gradient, or lack thereof, throughout the 0DTE SPX structure.
Gradient means we’re looking at the increasing and decreasing size of speculative positioning based on how calls and puts are distributed across strikes. This deeper analysis helps identify where price may encounter resistance or support with greater precision than simply knowing “calls are in control here.”
The Drunken Sailor Range becomes most valuable after price has broken out of the GEX/DEX zones. It helps you:
In the compressed timeframe of 0DTE, understanding where price might meander can be the difference between holding winners and watching profits evaporate. The Drunken Sailor Range sets realistic expectations for how far moves might extend and where they will likely encounter obstacles.
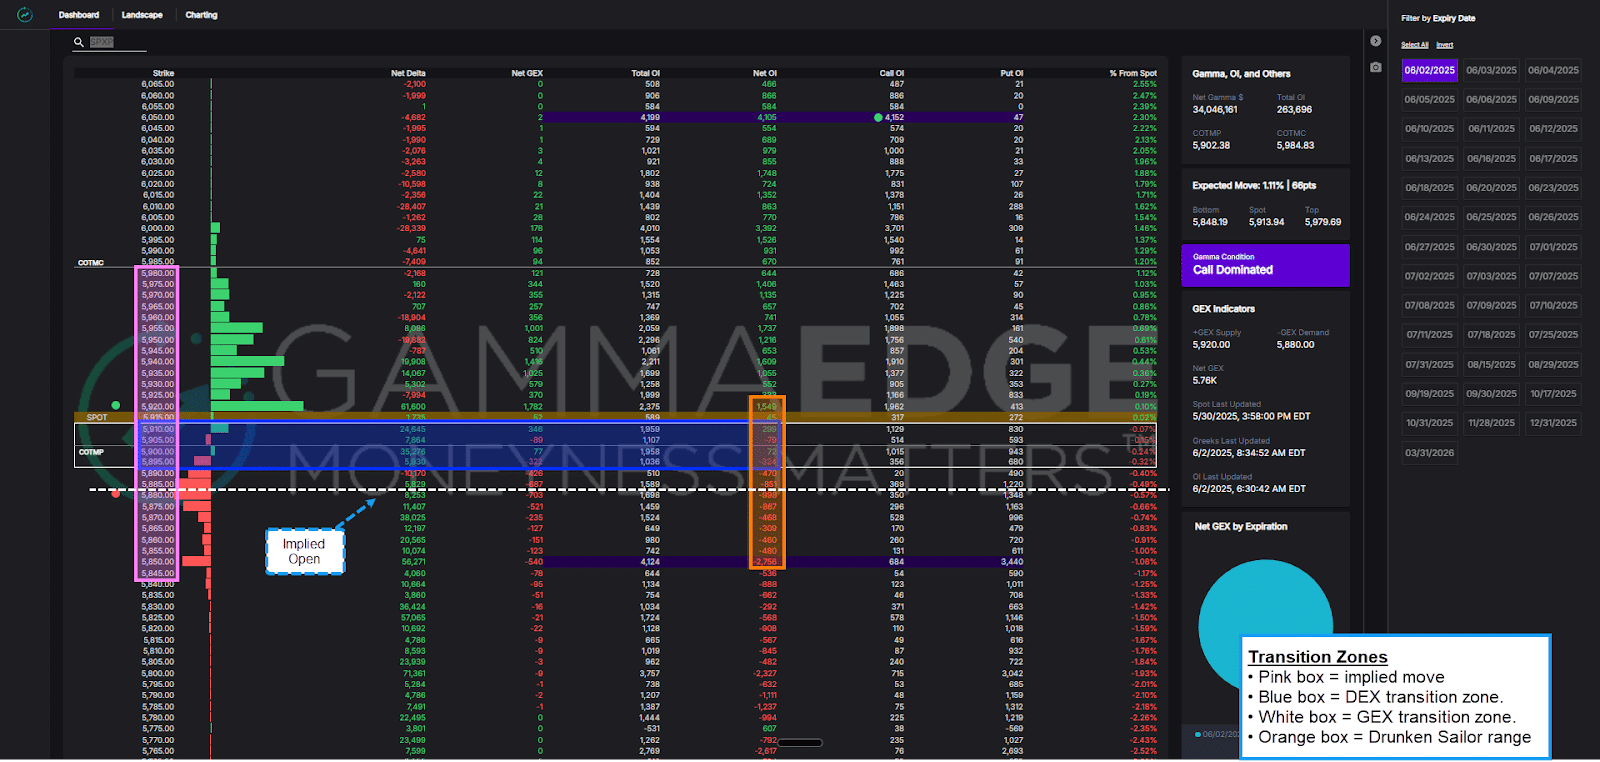
Visual Recognition
Look for areas where Net OI shows gradual changes rather than sharp transitions. These gradual shifts often create the “wandering” price action that characterizes these ranges.
In the video below, we take a deep dive into:
Pay special attention to how this range complements your understanding of the GEX and DEX transition zones you discovered earlier.
The real power comes from reading all zones together. When you understand how to combine the three approaches, you can distinguish between high-confidence setups and potential traps.
Your strongest setups occur when GEX and DEX zones overlap and remain relatively tight. This alignment indicates that short-term speculation (GEX) and underlying sentiment (DEX) point in the same direction.
What tight alignment means:
When zones are far apart, you’re looking at conflicting forces. GEX might show tight acceleration zones while DEX reveals mixed sentiment—or vice versa.
What wide divergence means:
Before entering any trade, run this systematic check:
This three-zone framework keeps you focused on structural forces while filtering out noise.
Start each trading day by identifying your transition zones:
For bullish setups:
For bearish setups:
Transition zones aren’t just entry signals—they’re comprehensive risk management tools:
When GEX and DEX zones diverge, prioritize DEX for directional bias and GEX for timing. DEX acts as your compass—showing underlying structural sentiment that’s less likely to shift rapidly.
Use DEX to determine whether you should look for long or short opportunities, then use GEX to time entries around acceleration points.
Absolutely. The methodology is fractal—it works across all timeframes. Apply the same principles to weekly options for swing trades or monthly options for longer-term positioning.
However, precision range analysis is most valuable for 0DTE trading due to unique time decay characteristics and volume patterns of same-day expiration options.
Professional options analysis platforms can display this data, but manual calculation requires significant options market knowledge. Many traders rely on services that provide pre-calculated zone levels as part of daily market analysis.
Our web app helps you visualize this instantly on a daily basis.
Think of this like a stretched rubber band—the further price moves from transition zones, the higher the probability of mean reversion back toward the middle. This is especially pronounced in 0DTE where time decay accelerates these tendencies.
When prices become significantly extended from all zones, consider taking profits on directional trades and looking for counter-trend opportunities.
The transition zones are most powerful when combined with our Market Trend Model and intraday volume analysis (specifically for the intraday timeframe). Here’s why this confluence matters:
The zones show you where things might happen, but the Market Trend Model and volume analysis confirm when and how they will likely unfold.
Pro-Tip: This is especially critical when trading the Drunken Sailor Range. Remember, these zones represent significant speculative buildups in the structure. You need to see substantial volume accelerating through those Drunken Sailor levels to expect continued movement higher or lower. Without that volume confirmation, price often stalls or reverses at these levels, exactly the “wandering” behavior the zone is designed to identify.
That’s it – you now have the complete framework that drives our daily SPX 0DTE (and/or swing trading) analysis. These three transition zones aren’t something you need to master over weeks; they’re tools you can start using in tomorrow’s session.
Every morning, we use exactly this process to break down the 0DTE structure. You’ve probably seen our YouTube videos, where we dissect the transition zones pre-market and review how they played out post-market. Now, you understand what we’re looking at and why these levels matter so much to our trading decisions.
The beauty of this approach is its simplicity. While other traders are drowning in dozens of indicators, you’re focused on the structural forces actually moving the market. You’re reading the playbook that options market speculators are writing.
This isn’t about predicting the future – it’s about understanding the mechanical forces that drive short-term price action in an options-dominated market. When you know where the big positioning sits and how market makers must respond, you can position yourself with the flow instead of fighting against it.
The framework is complete. The levels will be marked for you each morning. All that’s left is putting it into practice.