%201.avif)

SPXA vs SPXP: The Missing Piece Of SPX Options Market Analysis
.png)
Taylor Drake
.png)
December 12,2025
.png)
15mins read

Have you ever wondered why some market reversals fizzle out while others develop into sustained trends? The answer lies in understanding the different segments of the SPX options market and what they tell us about trader positioning. That’s where separating SPX into two distinct segments comes in — SPXA vs SPXP — to gain a more complete picture of market sentiment and potential turning points from institutional investors and large market participants.
Think of the SPX options market as two vessels navigating the same financial waters:
SPXP (PM-settled contracts) operates like a nimble speedboat – fast, reactive, and quick to change course. These are your daily, weekly, and 0DTE contracts dominated by short-term traders and active speculators.
SPXA (AM-settled contracts) is like a massive cruise ship – large and slow to change direction. These monthly and quarterly expirations represent substantial institutional positioning.

The SPXP expirations typically show structural changes first. Since these contracts are dominated by short-term traders who actively manage their positions, shifts in sentiment appear here faster than in SPXA.
When traders begin closing puts and adding calls, for instance, this appears in SPXP structure before anywhere else. The shorter expiration cycle means positions turn over rapidly, allowing us to detect positioning changes as they happen rather than weeks later.
This makes SPXP invaluable for:
However, SPXP signals alone can lead to false starts. The speedboat may change direction quickly, but that doesn’t mean the entire market will follow.
SPXA changes more slowly but carries significant weight when shifts do occur. These contracts represent institutional positioning with larger capital commitments and longer time horizons.
When institutions alter their positions, they’re making strategic decisions that typically signal sustained market moves rather than short-term speculation. This institutional backing provides the fuel for lasting trends.
When we see changes in SPXA structure:
The most powerful market signals occur when both components align:
When the speedboat and cruise ship are heading in the same direction, the entire market is likely to follow.
Let’s examine how this framework works in practice with examples from April 2025.
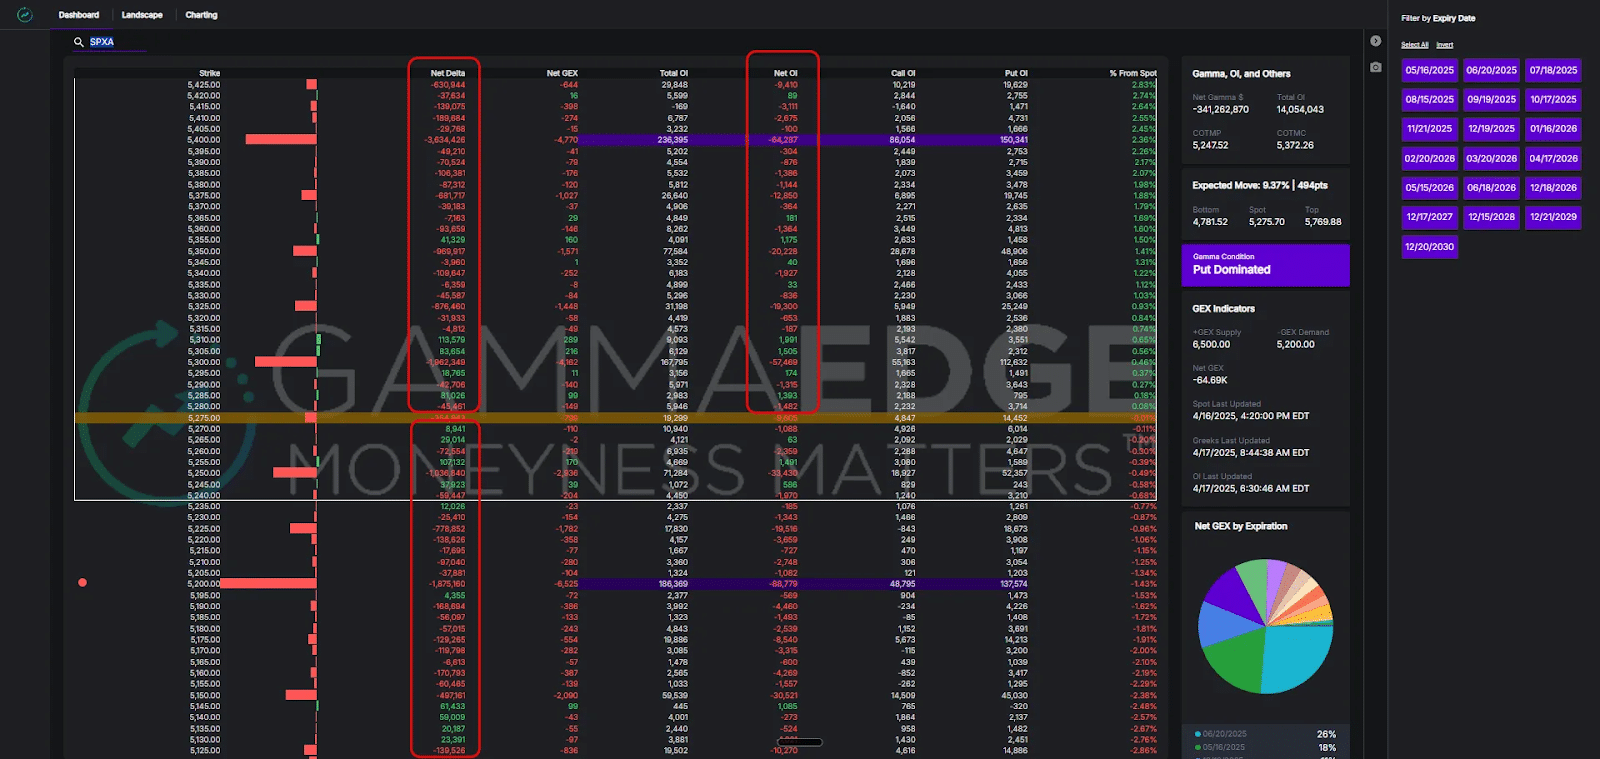
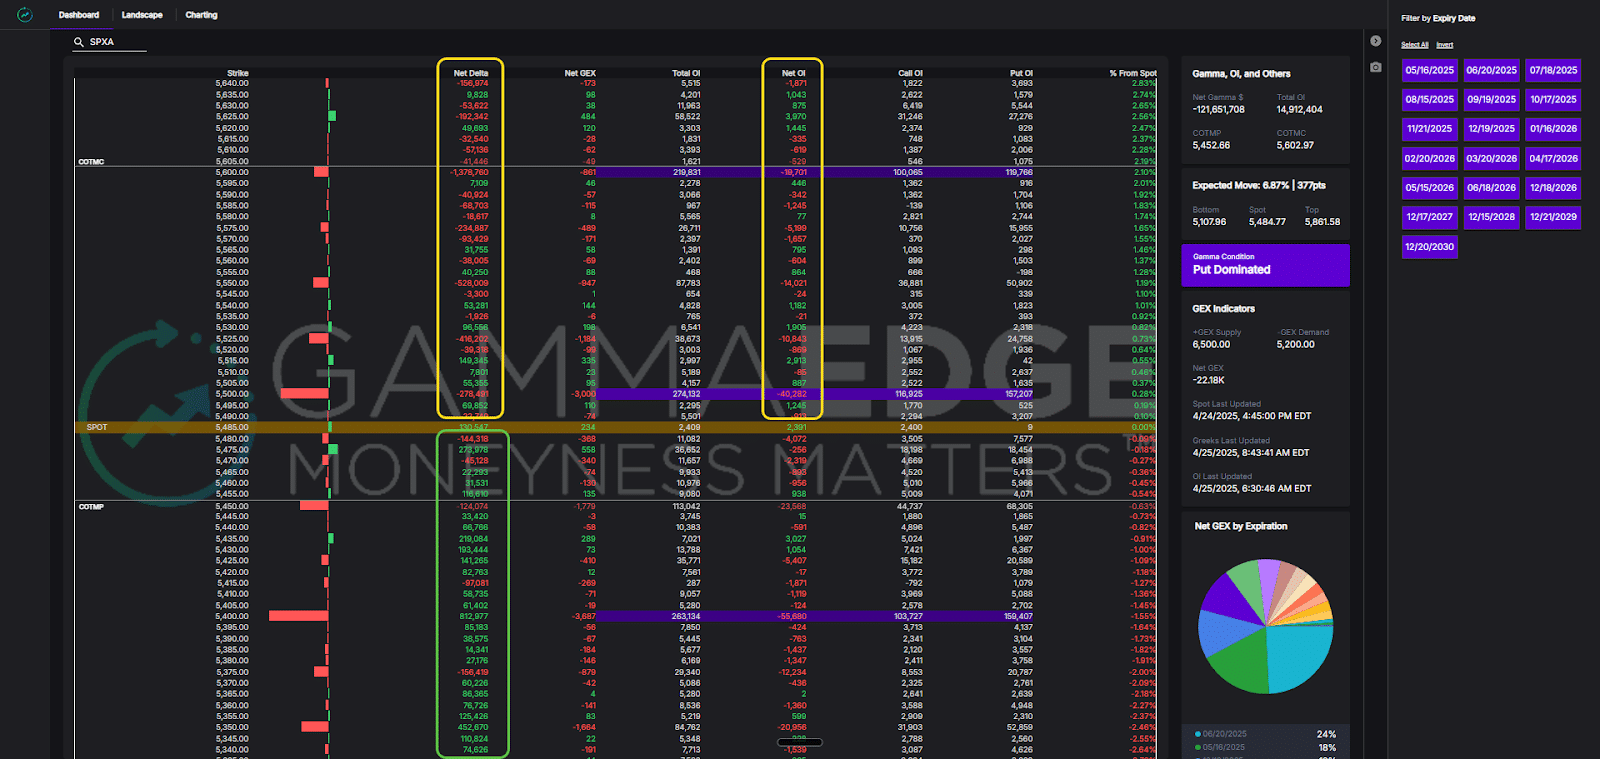
Starting with SPXA (The Cruise Ship), we can see the structure is entirely put-dominated above and below spot price. If you’re looking to take swings to the bullish side, this is not the structure you want to see.
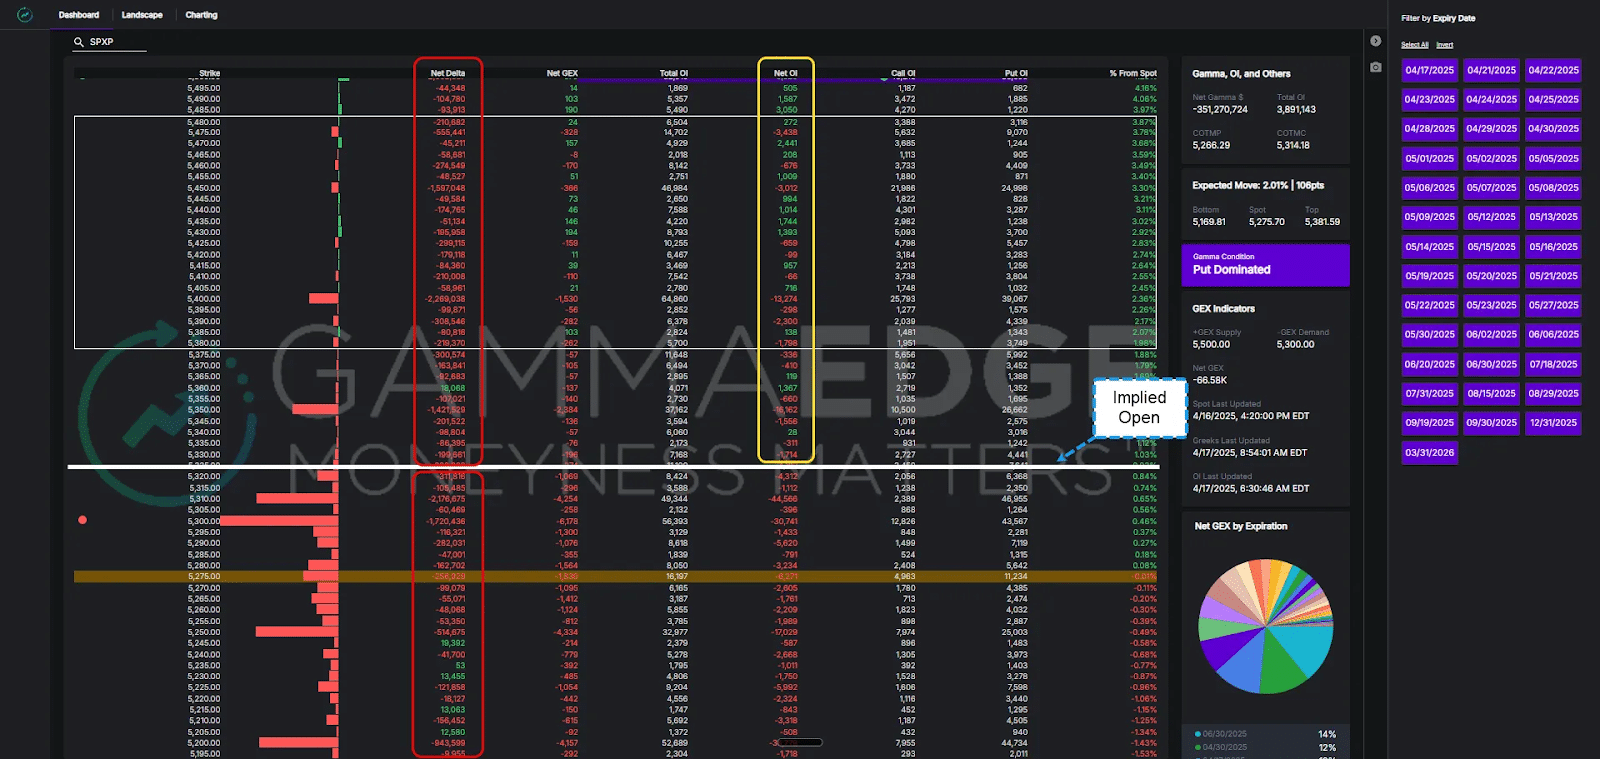
Next, moving to SPXP complex, which when looking at it, we can see again that puts are dominant in the structure above and below spot price. The one thing you will see in this structure relative to SPXA above, which we’ve highlighted in the yellow box, is the Net OI column – here you’ll see that calls are actually starting to dominate more strikes than puts, which is a constructive sign to see. However, you can see that to the left in the Net OI column is the Net Delta column, which shows all strikes are still dominated by puts. What this means is that while there are calls coming into the structure, when applying the Delta Greek to the open interest present (our measurement of our risk), calls are still in the minority.
This presence of calls in the structure doesn’t suggest an imminent reversal, but it’s worth noting as a positive divergence from the SPXA structure.
From here, we’d want to see this structure continue to improve and become more call dominated in the Net Delta column.
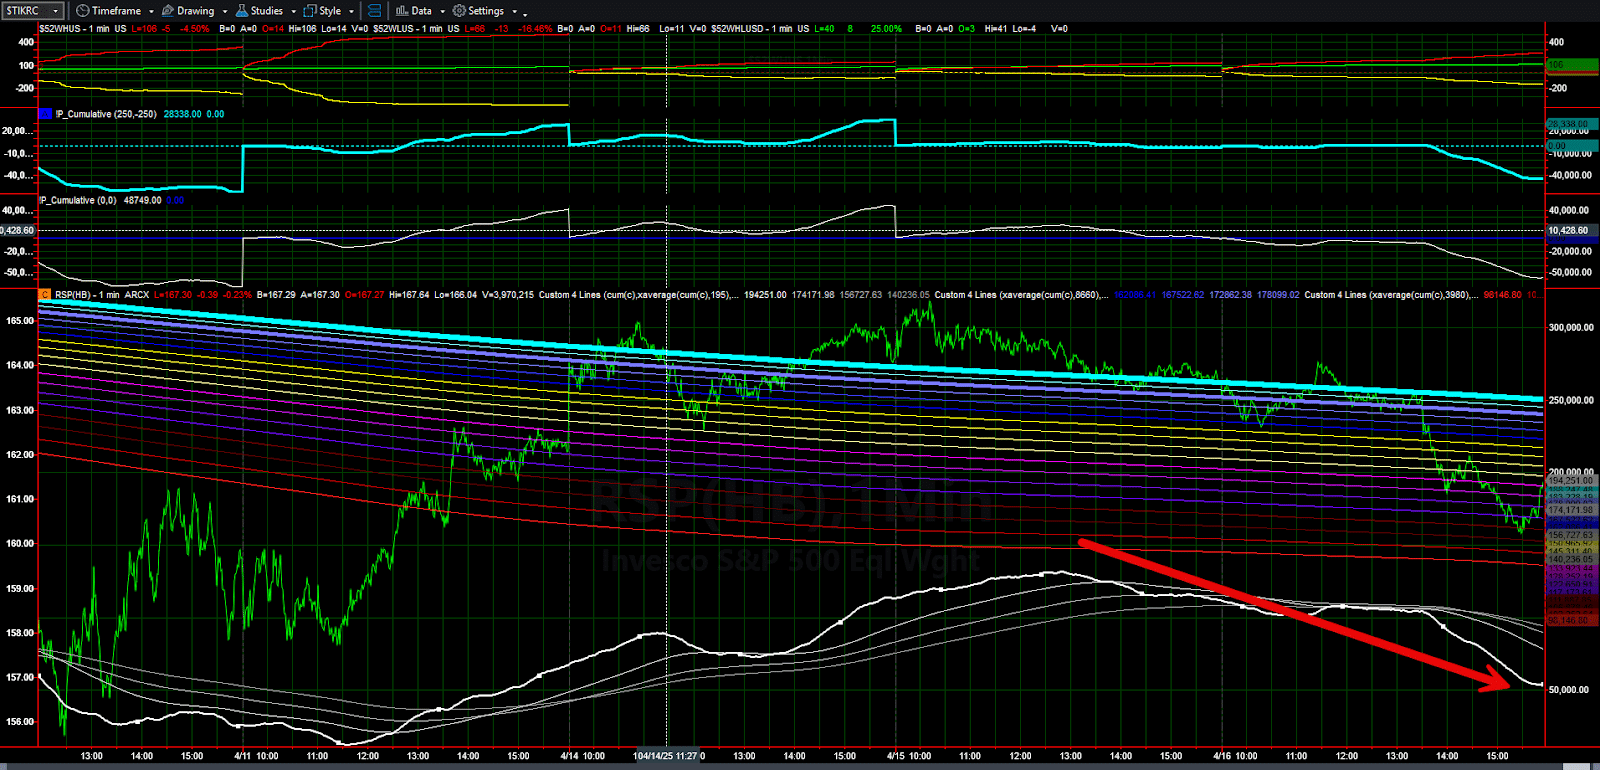
Because we mentioned our market turning framework, we’d be remiss if we didn’t include the Market Trend Model, which is another key pillar of that framework.
Here is what the Market Trend Model looked like on 4/17. This downward trending structure is in-line with the put-dominated structures of SPXP and SPXA we reviewed above.
So again, from our market turning model framework, the environment was not constructive to the upside.
Now let’s compare what we saw on April 17th, to the structure (and Market Trend Model) on April 25th.
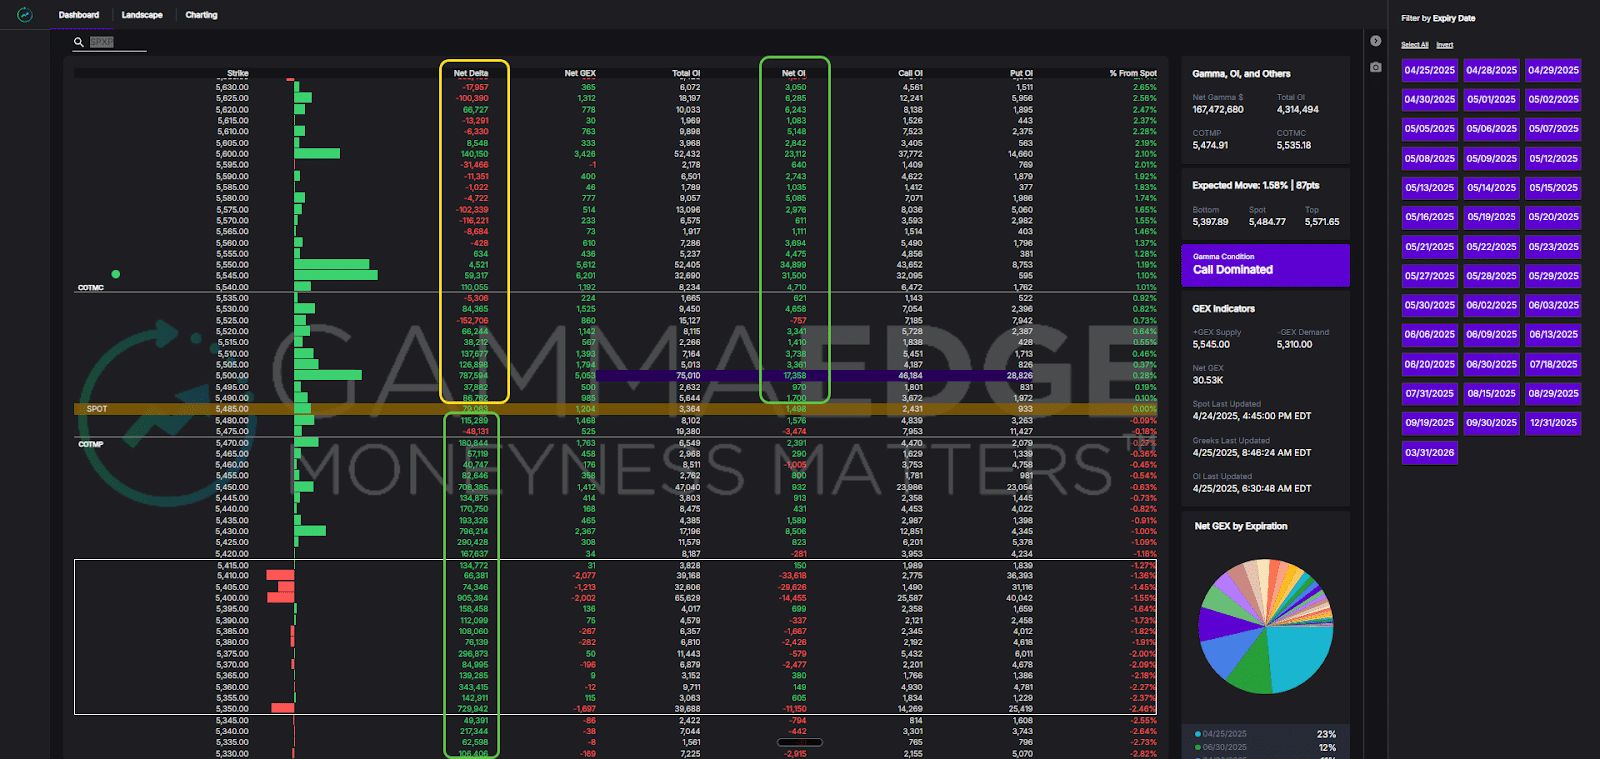
Looking at the SPXA structure, we can see right away how there are more call-dominated strikes in the structure, which is a constructive step forward compared to last week’s structure reviewed above..
Now going forward, we want to see the continuation of call speculation come into the structure because in a healthy market (underpinned by a bullish foundation) where we see price appreciation, all strikes are generally call-dominated throughout the structure – right now, there are many put-dominated strikes still in the structure, particularly overhead, which need to be cleaned up. But for the avoidance of doubt, this is a good step forward.
When looking next at the SPXP for April 25th, we can also see this structure looks quite healthy and is a much better step in the right direction – one that is more call dominated above and below spot price.
We do want to see this structure continue to remain call dominated and not regress back into put dominated territory. But again, this is a good example of showing how SPXP leads in terms of improvement in its structure first relative to SPXA, but SPXA is starting to show that confirmation we want to see.
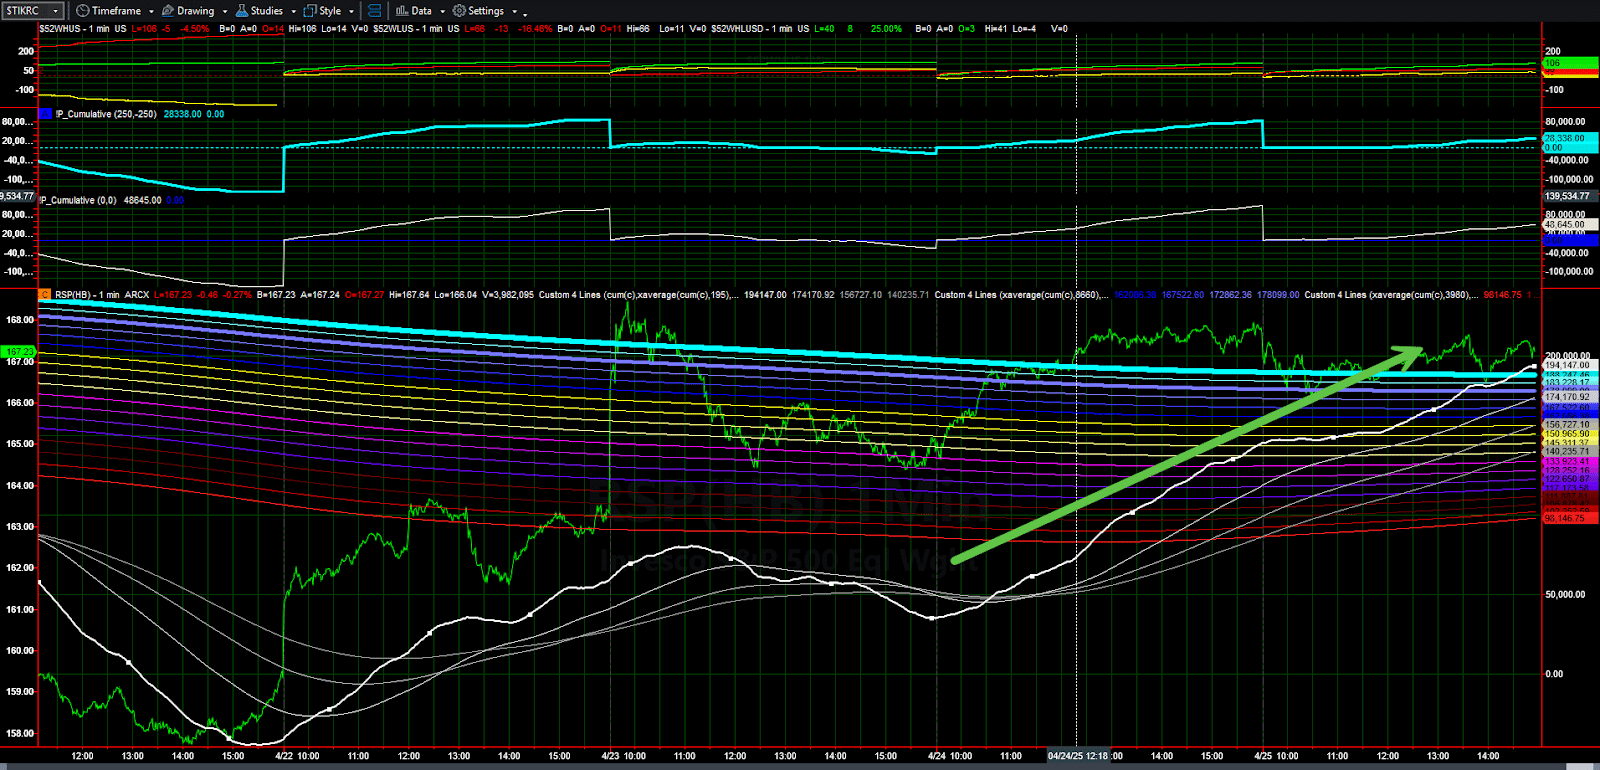
Lastly, we want to show what the market trend model looks like for 4/25 as well and what should be an obvious change in state from the 17th’s version.
By this we mean that the short-term trend is starting to move higher (rather than lower). This is constructed to see and provides confluence with the SPXP and SPXA structures, which are starting to be more call dominated.
Understanding market turning points requires recognizing a typical sequence of events:
This progression from momentum to short-term repositioning to institutional confirmation offers the highest probability setup for sustained market turns.
For a comprehensive breakdown of our market turning framework, read our complete Market Turning Framework Guide.
To incorporate this dual analysis into your trading routine:
Next time you’re analyzing the market, don’t just look at generic SPX data. Consider the separate stories being told by SPXP and SPXA – they might be telling you very different things about where the market is headed.
Most platforms don’t separate these components, potentially missing critical nuances in market structure. Understanding both the “speedboat” and the “cruise ship” of the SPX complex gives you an edge that most traders simply don’t have.
Note: The examples in this article are from past dates and don’t reflect current market conditions. Always use the most up-to-date information for your trading decisions.
SPXA refers to AM-settled SPX options contracts, which include monthly and quarterly expirations. SPXP refers to PM-settled SPX options contracts, which include daily, weekly, and most 0DTE expirations. The key difference is in their settlement times and the type of traders who typically use each.
Understanding the difference allows you to see market structure more clearly. SPXP shows you where short-term traders are positioning (early warning signals), while SPXA reveals institutional positioning (confirmation of sustained moves). Together, they provide a more complete picture than viewing SPX as a single entity.
Absolutely. Even if you trade stocks or futures exclusively, options positioning drives much of today’s market movement. Understanding SPXA and SPXP structure helps you identify potential market turning points and determine which trends have staying power, regardless of what instruments you trade.
Most retail platforms don’t separate these segments, making proper analysis difficult. At GammaEdge, our tools specifically distinguish between SPXA and SPXP structures, allowing traders to see the complete picture that others miss.
Ready to take your trading to the next level? Learn more about our options structure analysis and SPX 0DTE trading strategies.