%201.avif)

SPX 0DTE Options Volume Analysis: Predict Market Direction Before Price Confirms
.png)
Taylor Drake
.png)
December 12,2025
.png)
15mins read

Have you ever wondered why some trading days exhibit smooth, directional price action while others trap you in frustrating back-and-forth chop?
What if the answer isn’t found solely on your price chart but rather hidden in the flow of SPX 0DTE options volume throughout the trading session?
By analyzing SPX 0DTE options volume, you can unlock intraday market sentiment in real-time. More specifically, measuring how call and put speculators are transacting throughout the trading session can reveal three key advantages for your trading:
And the best part of SPX 0DTE options volume analysis is that we’ve built specific tools to analyze (and more importantly) make actionable this intraday volume.
While many traders rely on price-based indicators that lag behind market reality, our Intraday Volume Analysis tools let you see what’s happening under the hood of the market right now, allowing you to adjust your strategy as conditions change.
For example in SPX 0DTE options trading:
And if you’d like a further breakdown of everything we’re going to cover today, you can click here.
As we started down the path of Volume Analysis, we naturally began at a higher-level and then got more granular as our understanding increased; we didn’t know what we didn’t know.
This led us to develop our first volume analysis tool: $volu.
The $volu command measures option volume for the current trading session by strike and by expiration. Think of it as a snapshot of where all options activity is taking place across the entire SPX options chain.
To use this command, simply type $volu spx in the Discord command line. This produces a visualization showing call and put volume distribution across all strikes and expirations.
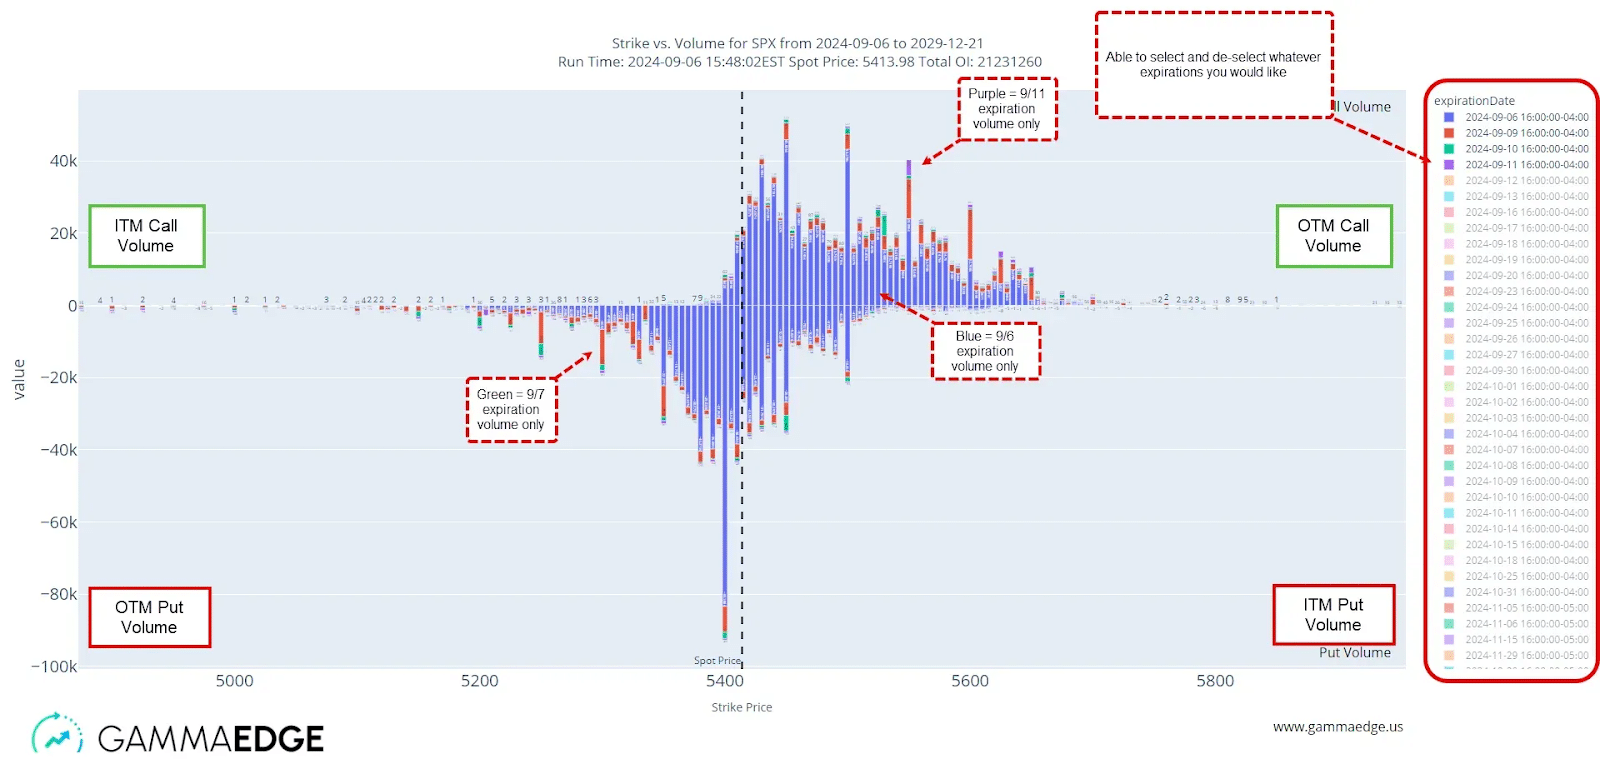
How To Read The SPX Options Volume Chart:
NOTE: The chart is dynamic, which gives you the ability to select specific expirations to focus on, allowing you to isolate activity for particular dates.
While $volu gives us a comprehensive view of all SPX options activity, its true power lies in unlocking for you:
As a starting point each morning, we use the Web App Dashboard for understanding key levels derived from the SPX options market. However, once the opening bell rings, the $volu command becomes essential for tracking where intraday volume is flowing in real-time.
For example:
This forward-looking perspective is crucial – we always emphasize skating to where the puck is going, not where it is.
While analyzing the $volu output, we realized that a significant amount of SPX was transacting in the 0DTE contract (40-60%). This concentration meant we needed to develop more specialized tools to understand this specific contract expiration for intraday trading.
Building on what we unlocked with $volu, we needed a tool to specifically track how SPX 0DTE options volume by strike was changing throughout the session. This led to developing $vold (VOLume Differential).
$vold displays SPX 0DTE options volume in 5-minute slices throughout the trading session and offers two key pieces of information:
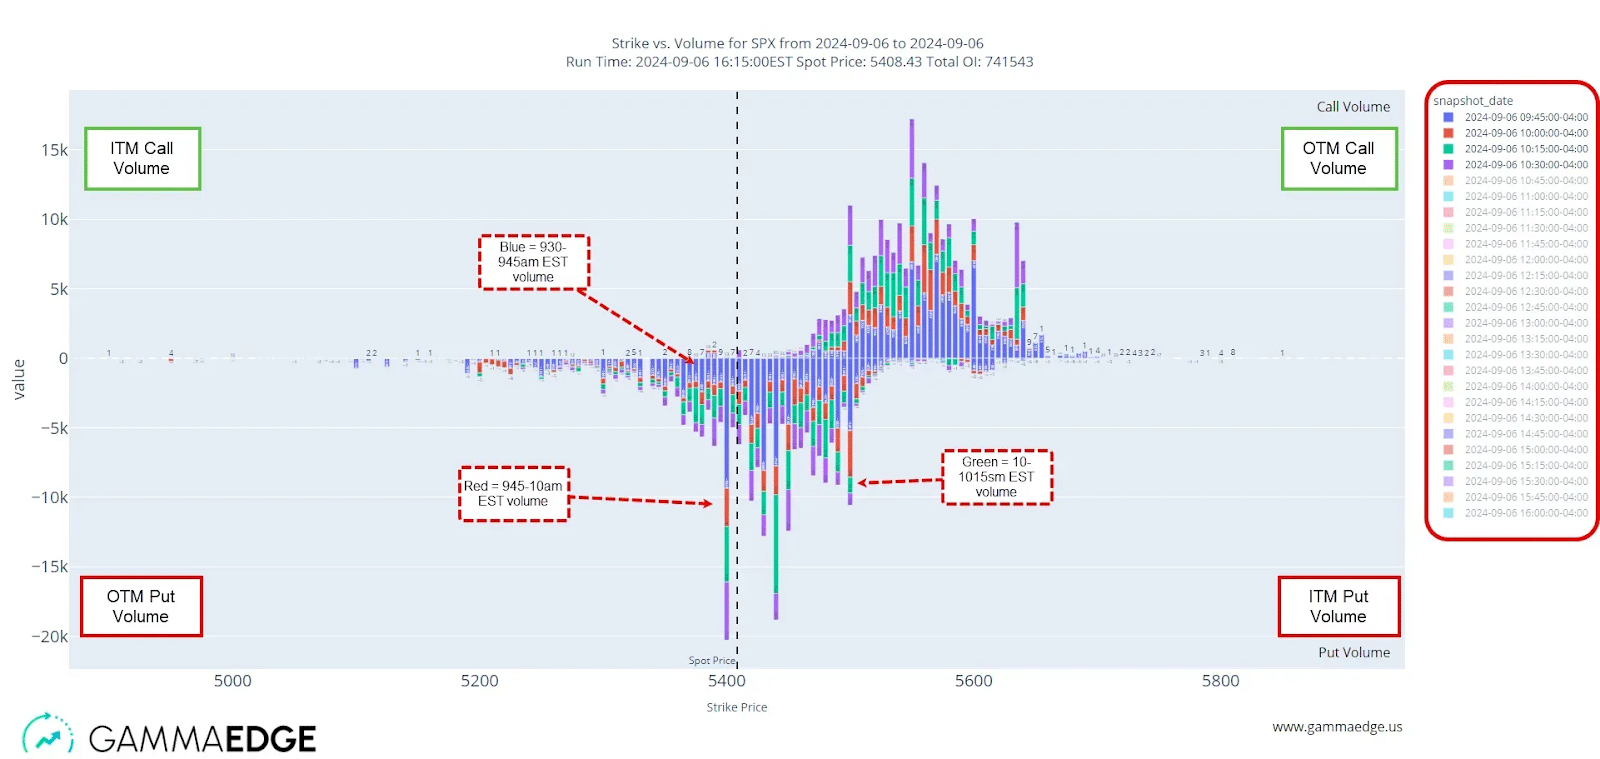
The $vold command transforms how you approach intraday trading by revealing:
When combined with price action, $vold reveals the “why” behind price movements. For example, if price suddenly rallies, $vold will show whether the move is supported by increasing call volume at higher strikes (suggesting continuation) or if volume remains concentrated at lower strikes (suggesting limited upside).
What traders quickly notice when using $vold is that certain patterns emerge in how call and put volume shifts throughout the session. On trending days, volume consistently targets strikes in the direction of the trend. On choppy days, volume oscillates between calls and puts without meaningful expansion higher or lower.
This observation led to our most powerful tool: $volm, which takes the data from $vold and transforms it into a visualization that instantly reveals the character of the trading day and where price could likely be headed.
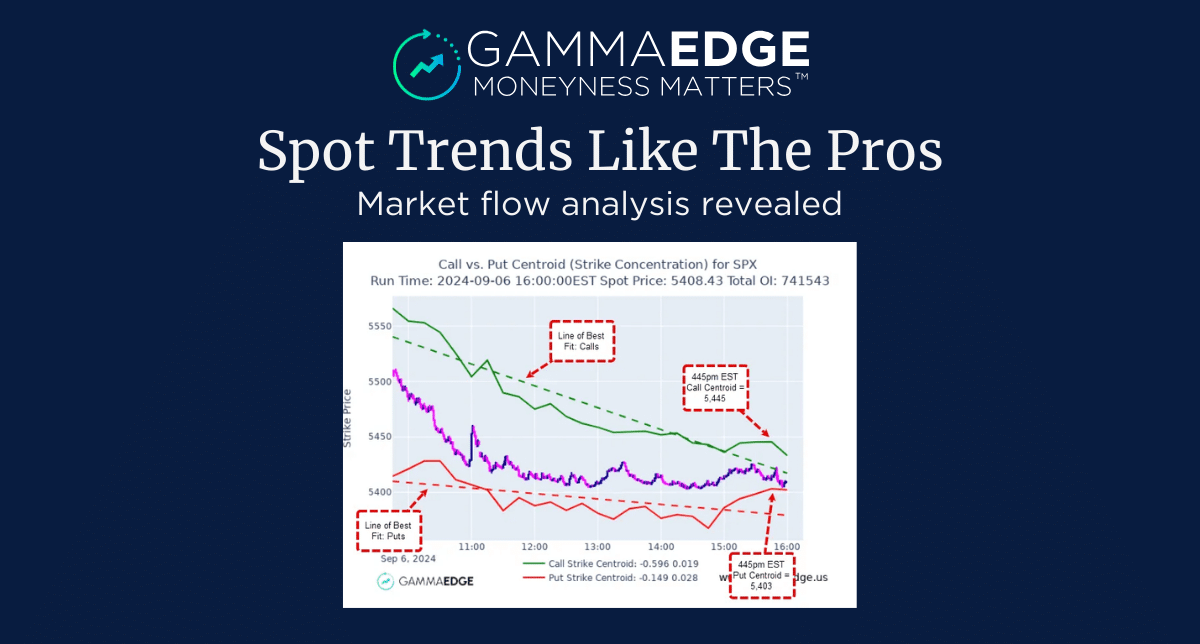
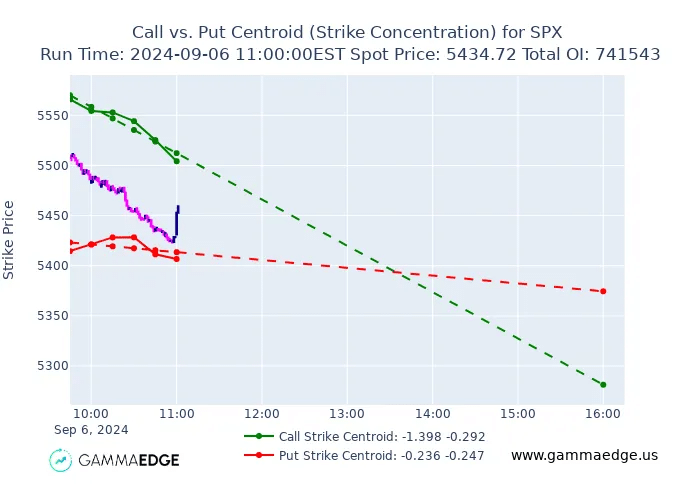
After developing $vold to track SPX 0DTE options volume in 5-minute slices, we realized we needed a more intuitive way to visualize how call and put sentiment shifts throughout the session. This led to the development of $volm (VOLume Momentum) – our most powerful intraday SPX options volume analysis tool.
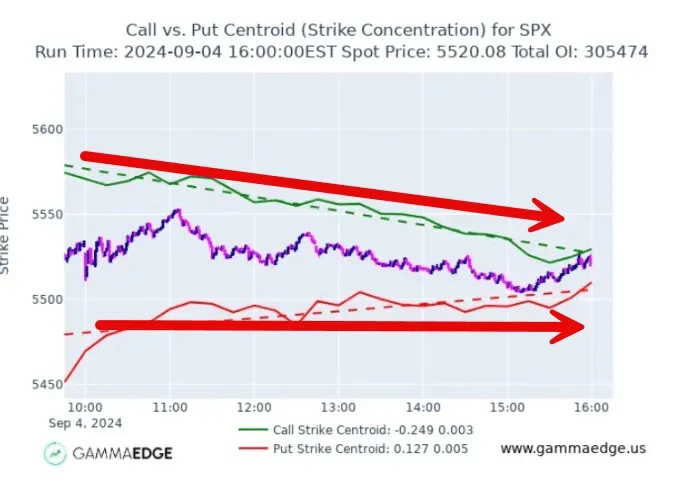
The $volm command transforms the raw SPX 0DTE options volume data from $vold into a visualization that immediately reveals the character of the trading day.
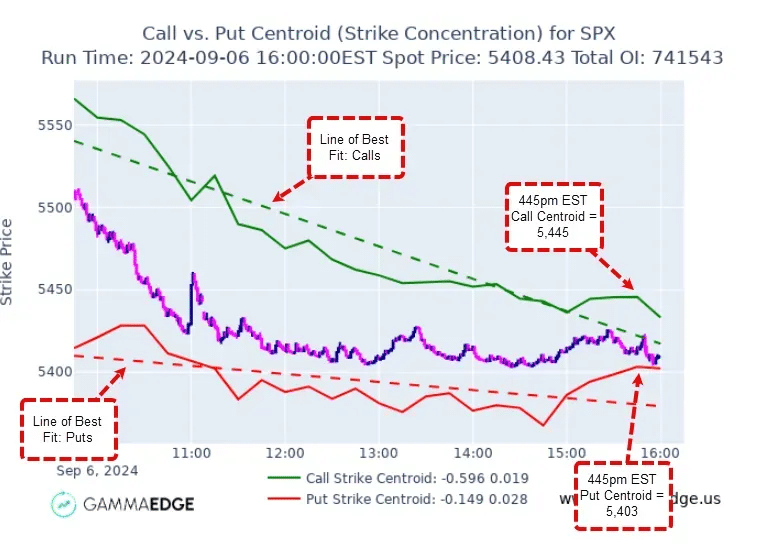
In addition to the centroids, the $volm visual also plots our “lines of best fit” (dashed lines) that project the trend of these centroids to the trading close, giving you probable price targets for the session.
Said another way, if we know how speculators have acted/transacted from the open through any specific point in time during the trading session, assuming all else equal, we can then logically project out how those centroids will continue through the remainder of the session (like shown in the example below).
To reinforce this point, $volm is a measurement of market sentiment in the moment as reflected through SPX 0DTE options volume traded by strike, which we then plot throughout the session via the centroids.
It’s important to note that SPX options volume analysis is not a predictor of price. However, we can utilize the ‘lines of best fit’ to show where price could finish assuming the market continues to do what it has been doing in terms of transacting at specific strikes as measured by the SPX 0DTE options centroids.
This ‘line of best fit’ is a linear regression utilizing the 5-minute SPX options centroid values through that point in time. This line shifts throughout the session as the centroid values change.
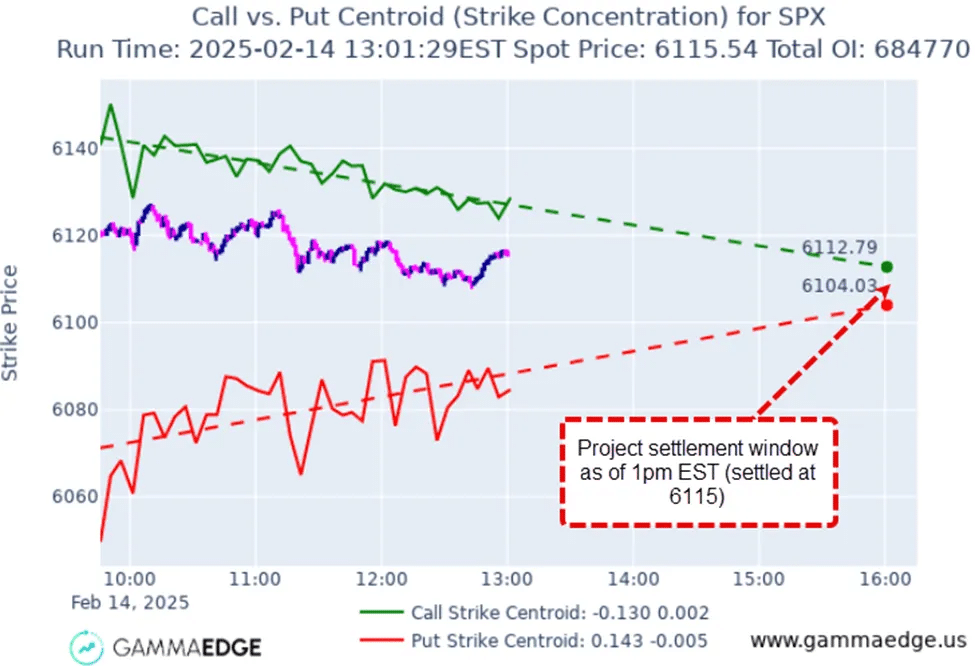
Assuming all things equal, if we know where spot price could finish the session based on SPX 0DTE options volume, this knowledge can then be used to inform potential trade ideas. Said another way, if the market continues to target the same strikes it has been (via the SPX options centroids), then we know the goal posts of where spot price could finish the session.
However, this is not the only use of SPX 0DTE options $volm analysis. Another key use is it can provide us with an understanding as to the character of the trading session, in terms of a chop day vs. a trending day in SPX options.
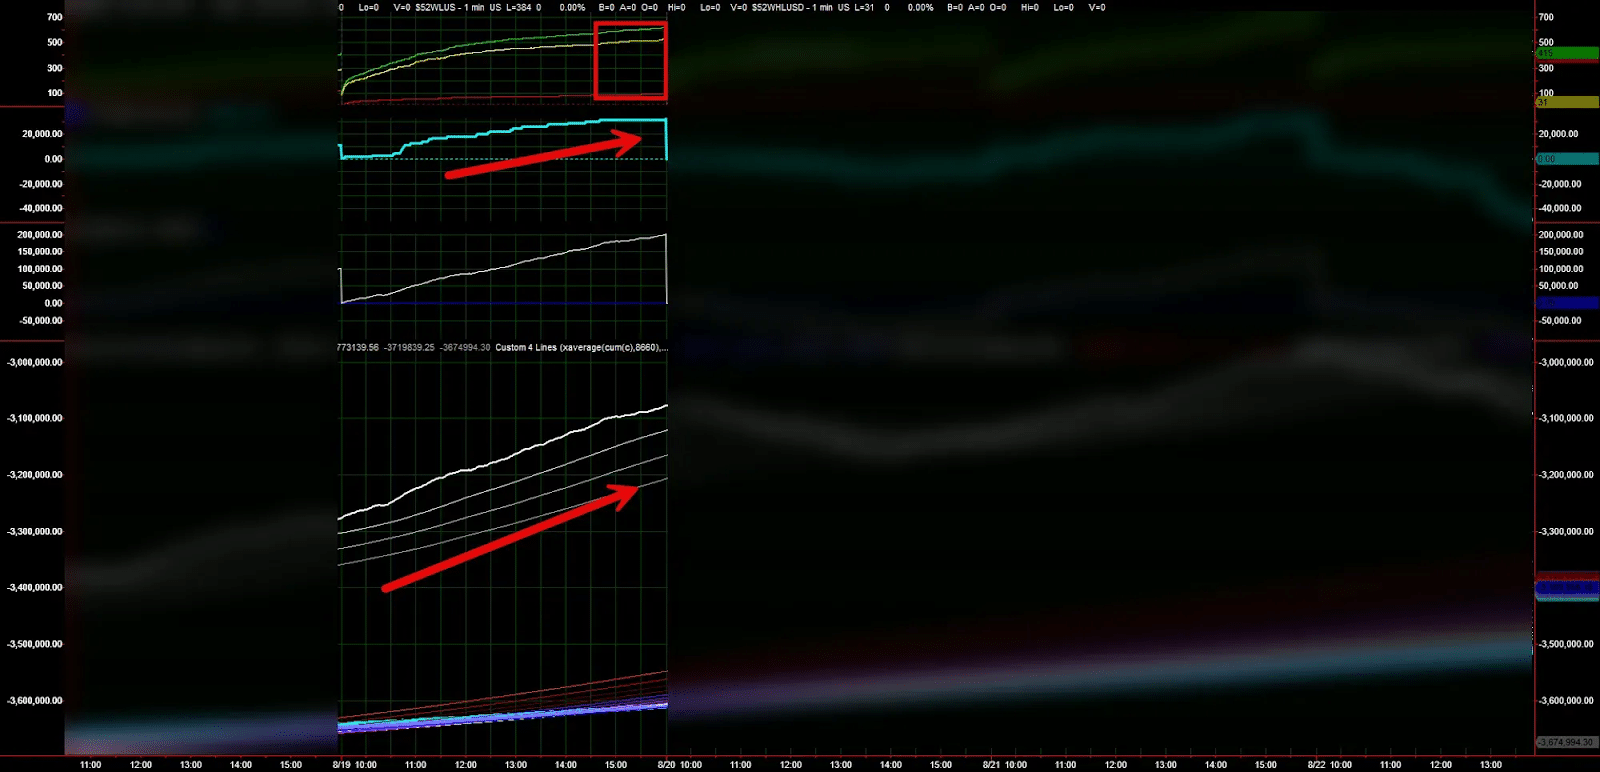
Pro-Tip: Pay attention to the action of the Cumulative Tick via the Market Trend Model and the SPX 0DTE options $volm command. They often show intraday confluence with each other.
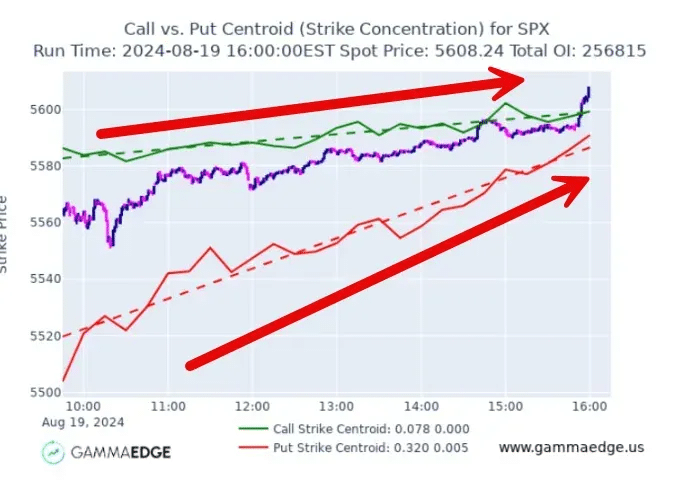
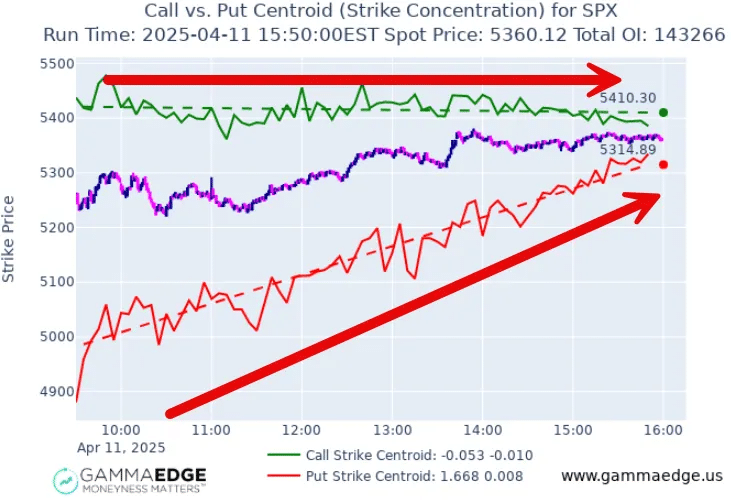
What makes SPX options $volm analysis so powerful is its ability to immediately reveal the character of the trading day in terms of chop vs. trending. There are four primary SPX 0DTE options volume patterns that consistently appear:
What it looks like:
What it means:
Trading implications:
Pro-Tip: Here is an example of using the $volm command with the Market Trend Model (from the same day). We can see powerful confluence between the Cumulative & Filtered Tick trending higher along with the call & put centroids.
What it looks like:
What it means:
Trading implications:
What it looks like:
What it means:
Trading implications:
What it looks like:
What it means:
Trading implications:
In addition to the 4 SPX options $volm states above, it’s also incredibly useful for showing us when structure is changing in SPX 0DTE options.
Take a real example from 09/11/24. In the morning session, both call and put SPX 0DTE options centroids were trending lower, indicating bearish momentum (this aligned with the Cumulative Tick, which was also trending lower through 11am EST).
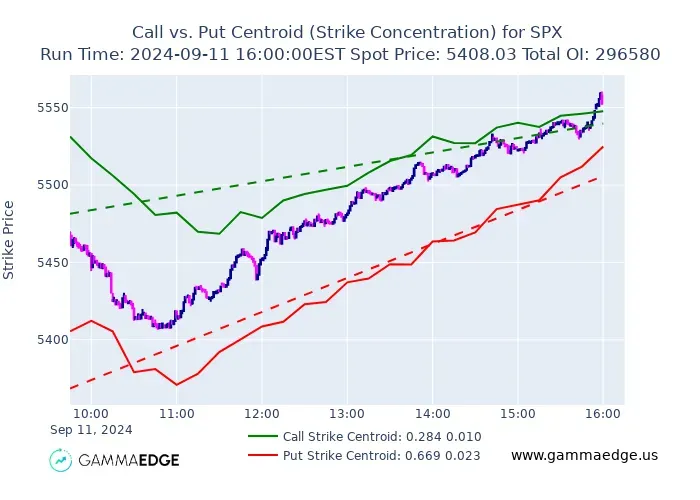
Around 11am EST, something critical happened – both indicators began to reverse — the Cumulative Tick started trending higher, and simultaneously, the $volm centroids began to shift direction.
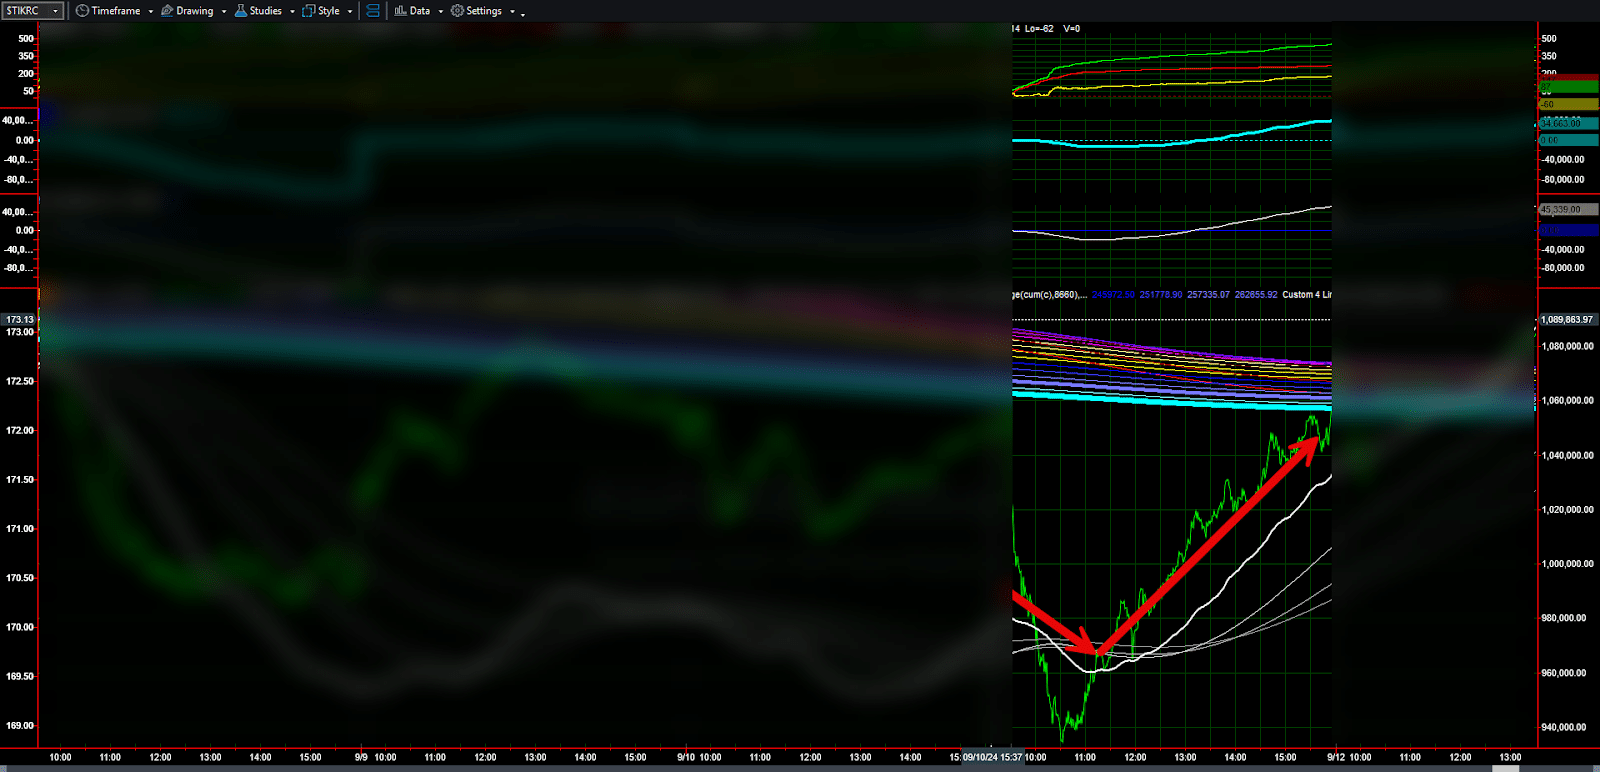
This confluence provided a powerful signal that the morning’s bearish trend was reversing – giving traders confidence to flip from short to long positions.
What makes this example so instructive is the timing – both the Cumulative Tick and $volm centroids shifted together, providing multiple confirmations of the changing market character. While price action remained choppy during this transition, these tools clearly signaled the underlying shift in sentiment.
By tracking this evolving sentiment through the centroids, traders could anticipate the afternoon’s bullish price action well before it fully materialized on the price chart.
Through extensive testing and observation, we’ve developed several key guidelines for using $volm effectively:
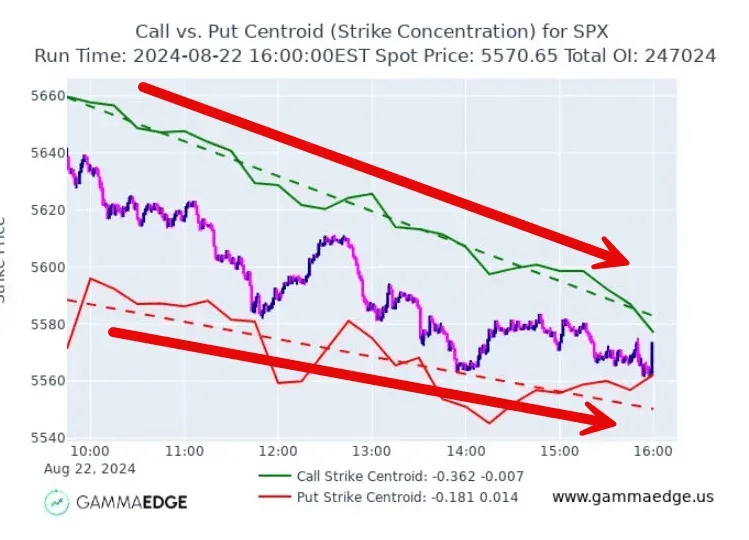
This condition generally only happens in the morning. Remember, the lines of best fit are generated from the centroids themselves. Therefore, we need to have several centroids formed before the trends start to make better sense intraday. However, with the knowledge and examples we have discussed in this module, you should be able to understand what is happening.
Let’s take the example below. Here we can see the green (call) line of best fit is pointed well lower while the red (put) line of best fit is flat to slightly lower. What can we imply from this…? Calls are being closed much more aggressively than put are being opened, which would give us a sideways to lower bias.
Using the call side for this example, as the centroid line shifts above the line of best fit, this tells us the market intentions are moving higher from what they previously were. If the centroid is below the line of best fit, then this tells us the market intentions are shifting lower from where they previously had been throughout the session.
This same logic can be applied to the put side, but flipped.
We find it best to use this analysis on SPX given the majority of volume occurs at the 0DTE contract, as opposed to stocks/ETFs, which only offer weekly expirations.
We find that this command works best after the London close, which is at 11:30am EST.
Through our progression from $volu to $vold and ultimately to $volm, we’ve developed a comprehensive system for understanding market sentiment in real-time through SPX 0DTE options volume.
Unlike conventional technical analysis that relies on lagging price patterns, our SPX options volume analysis tools let you see where options speculators are focusing their activity, giving you understanding of:
By combining these SPX options tools with our Market Trend Model, you create a powerful system for identifying high-probability trade setups while avoiding low-probability environments.
Here’s how to start using volume analysis in your very next trading session:
By adding SPX 0DTE options volume analysis to your trading toolkit, you’ll gain a significant edge in understanding market sentiment that most traders never see. Remember, price is the last thing to change – by tracking options volume, you’re seeing where the smart money is positioning before those moves appear on the price chart.