%201.avif)

Spot Market Trends Earlier & Faster Using GEX Ratio and Delta Balance
.png)
Taylor Drake
.png)
December 12,2025
.png)
15mins read
Have you ever traded a stock that appeared bullish on your charts, only to get repeatedly stopped out? You’re likely fighting against deteriorating market structure that isn’t visible on traditional price charts. What if you could spot these warning signs days—or even weeks—before they materialize in price action?
This is exactly what advanced options analysis tools like the GEX Ratio and Delta Balance enable traders to do. By revealing who’s winning the battle between bulls and bears beneath the surface, these tools ensure you’re focused on the most structurally sound stocks for your trading bias.
Over the past decade, the U.S. options market has experienced explosive growth. Due to this expansion and the substantial size of options contracts relative to underlying stocks, we increasingly see scenarios where options directly.
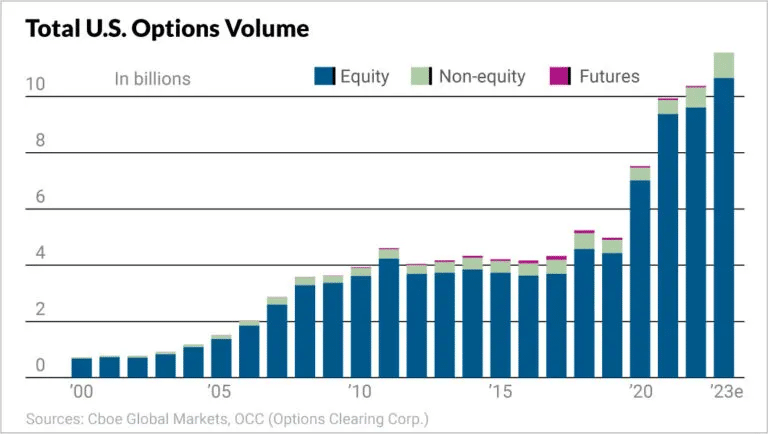
Over the past decade, the U.S. options market has experienced explosive growth. Due to this expansion and the substantial size of options contracts relative to underlying stocks, we increasingly see scenarios where options directly drive spot price movement.
At GammaEdge, we focus on:
For every stock with liquid options markets (AAPL, TSLA, NVDA, etc.), there’s a constant tug-of-war between call speculators betting on higher prices and put speculators betting on lower prices. Understanding which side is gaining advantage—and whether that advantage is growing or diminishing—can keep you from trading stocks that are quietly weakening before that weakness appears in price charts.
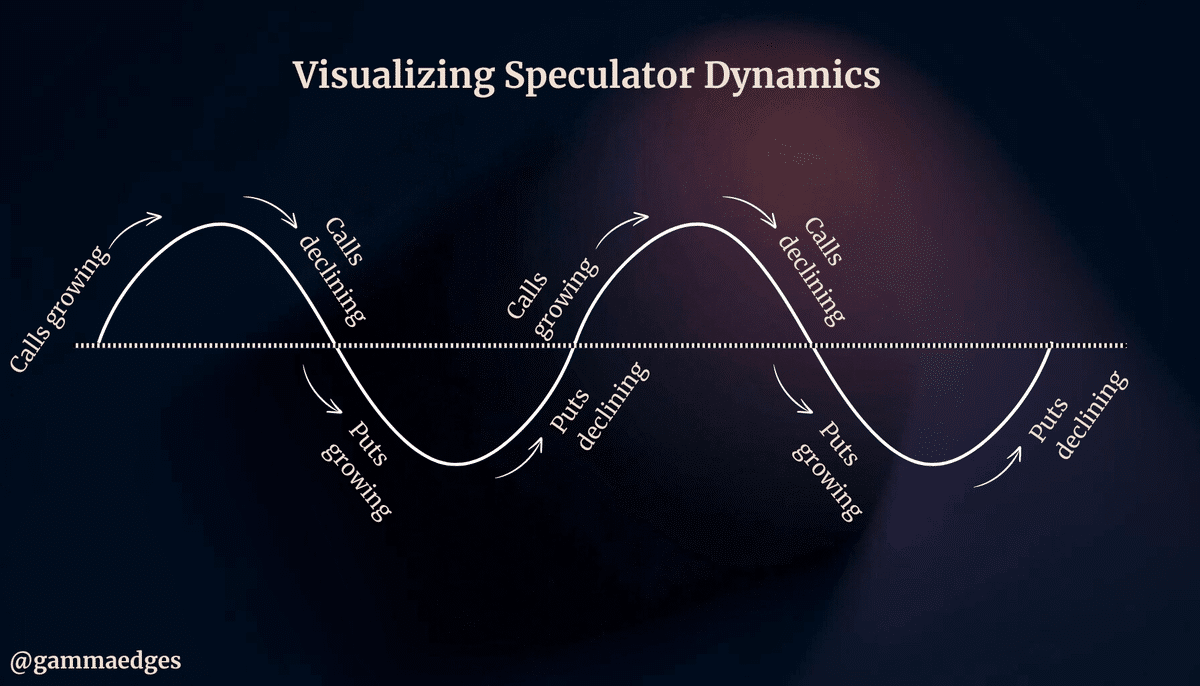
The GEX Ratio measures total call gamma relative to total put gamma across all expirations, serving as a powerful indicator to spot market trend changes early. Think of it as an enhanced version of the traditional Put/Call ratio, but with a crucial difference: it incorporates TIME through gamma, an element most traders overlook when analyzing options market data.
Gamma sensitivity increases as expiration approaches, so the GEX Ratio naturally emphasizes short-term market trends and activity. This timing element provides several advantages for traders looking to spot market trend changes before they appear on price charts:
When a large trader opens significant put positions far in the future, traditional options market indicators might spike dramatically. However, with the GEX Ratio, distant trades have minimal impact because they’re too far out to influence immediate market structure. This allows you to focus on the options market activity that most directly impacts current price charts and trend changes.
The GEX Ratio helps traders gauge the balance of power in the options market:
Pro Tip: Individual stocks typically maintain a ratio greater than 1. The key is understanding the trend and where the current ratio sits within its historical range for that particular stock.
Let’s examine how the GEX Ratio predicted price movements in Tesla:
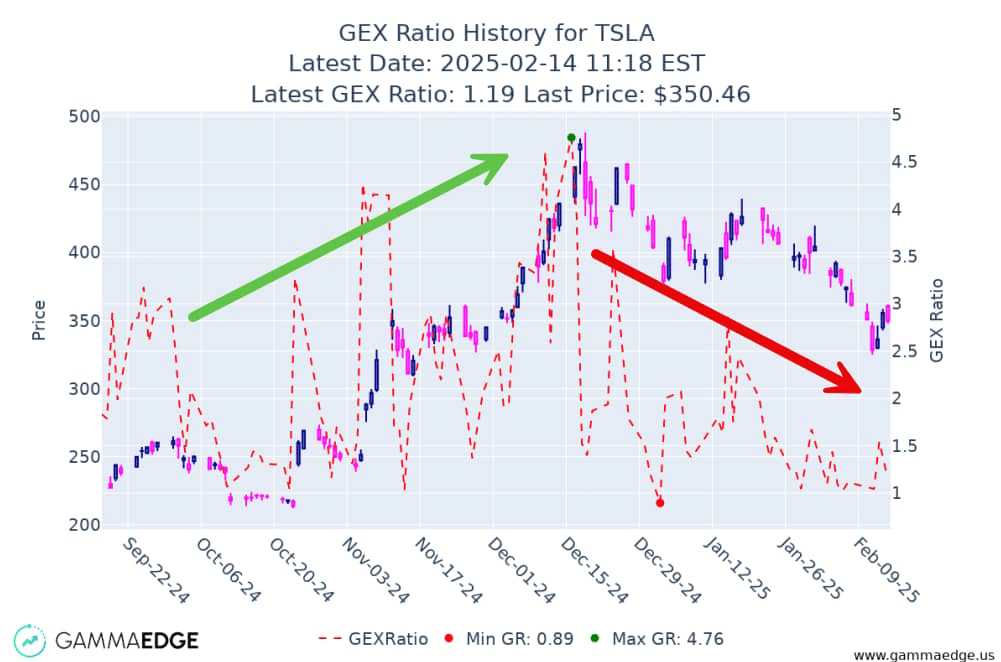
October through Mid-December 2024:
Mid-December 2024 through February 2025:
Key Insight: TSLA’s historical ranges show that readings above 4 suggest extreme bullish positioning, while ratios around 1 indicate bearish structure. While these aren’t absolute limits, they mark significant extremes worth monitoring.
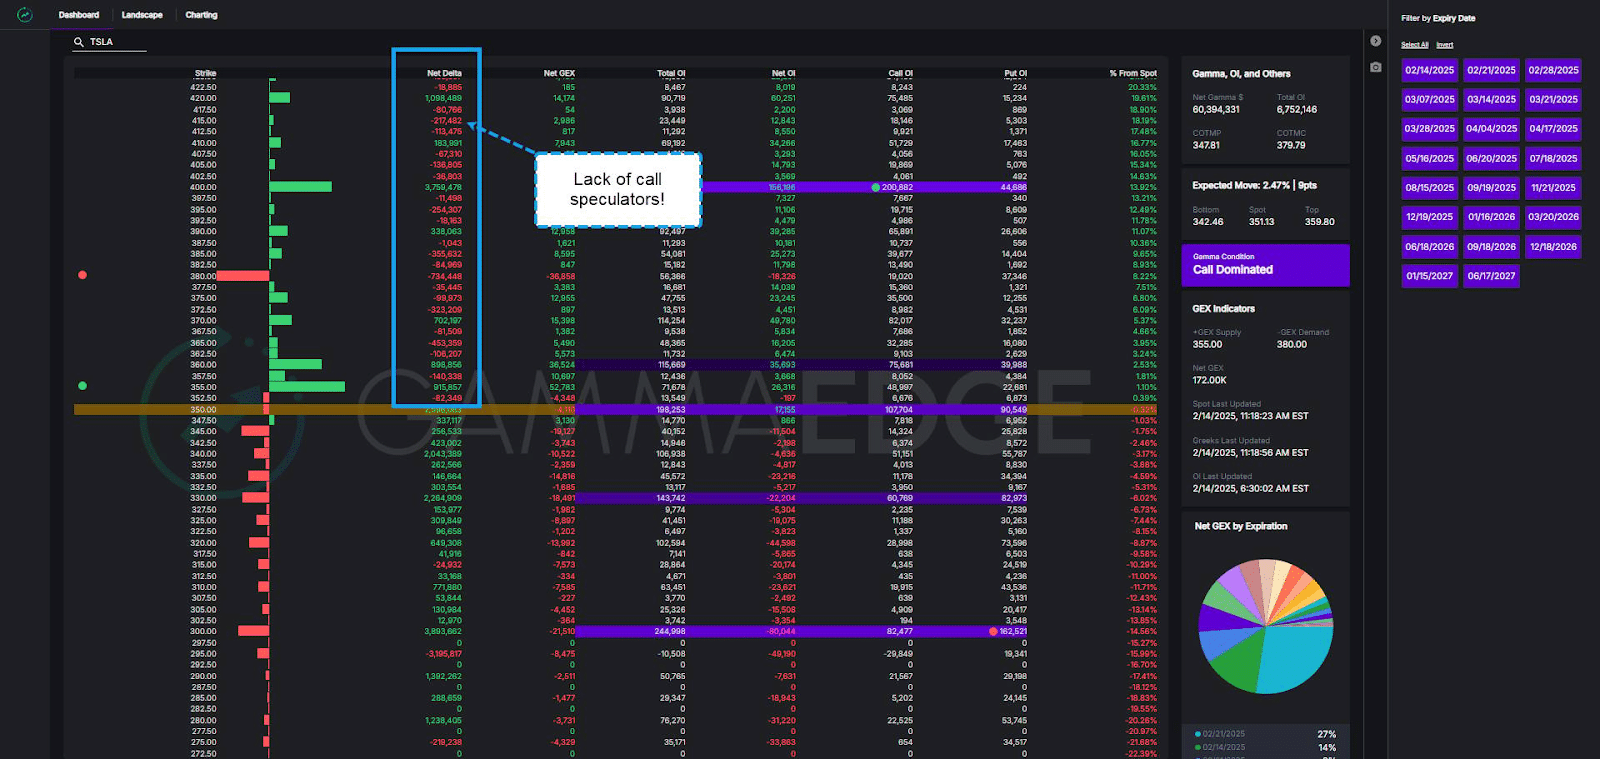
Looking at our Web App, which is a visual of TSLA’s options structure via speculators’ positioning, it confirms the weakness we see in the GEX Ratio. While call holders dominate below spot price, there is a significant lack of call speculation above spot price. A dominance of call speculators above spot price is what we typically see in names that make sustained moves higher, so this condition needs to improve in TSLA.
To recap:
For TSLA to turn constructive, we need to see:
While the GEX Ratio helps us understand if bulls or bears are gaining strength over time, we need another tool to visualize what future market trends look like on price charts. This is where Delta Balance becomes invaluable for traders looking to spot market trend changes before they become obvious.
Think of Delta Balance as your structural GPS—it tracks how call and put positioning (expressed through Delta) evolves above and below current price levels. Crucially, it doesn’t just show present conditions but reveals what speculators anticipate in coming weeks.
The Delta Balance tool produces three key trend lines:
Each line provides essential information:
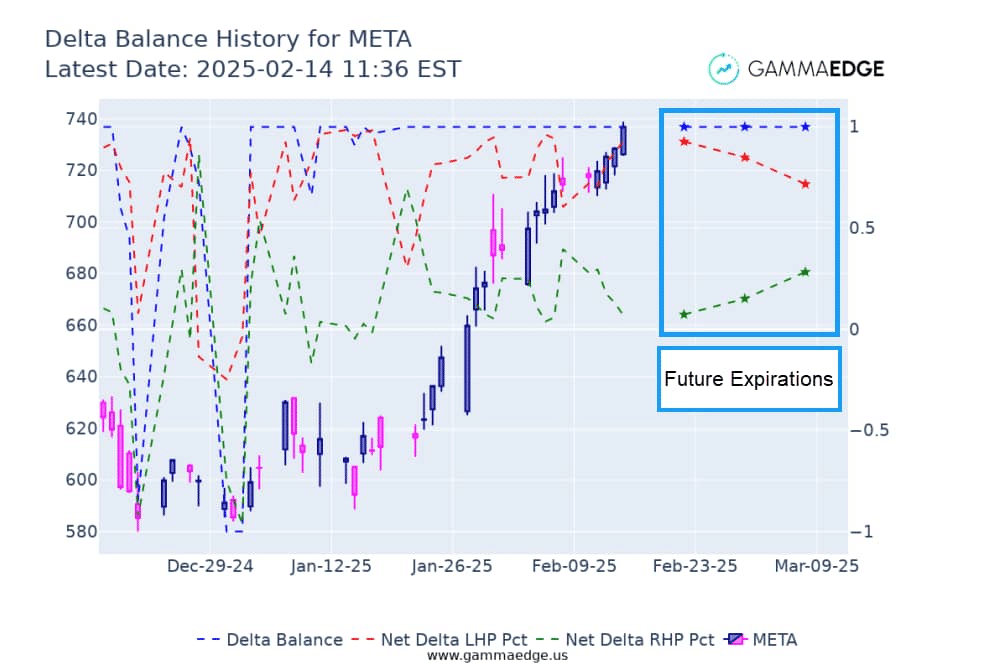
Let’s see how this plays out with META (example is above):
January Performance:
Current Structure (as of 02/14/25):
Future Outlook: Looking at the blue box (future expirations):
The Delta Balance tool answers a critical question: “Is the current market structure likely to persist?”
We know the META $dbh command visual from 02/14/25 above showed bullish forward conditions. We also know there was a significant decline that occurred after 02/14/25 and the $dbh was critical in showing us this future weakness. How?
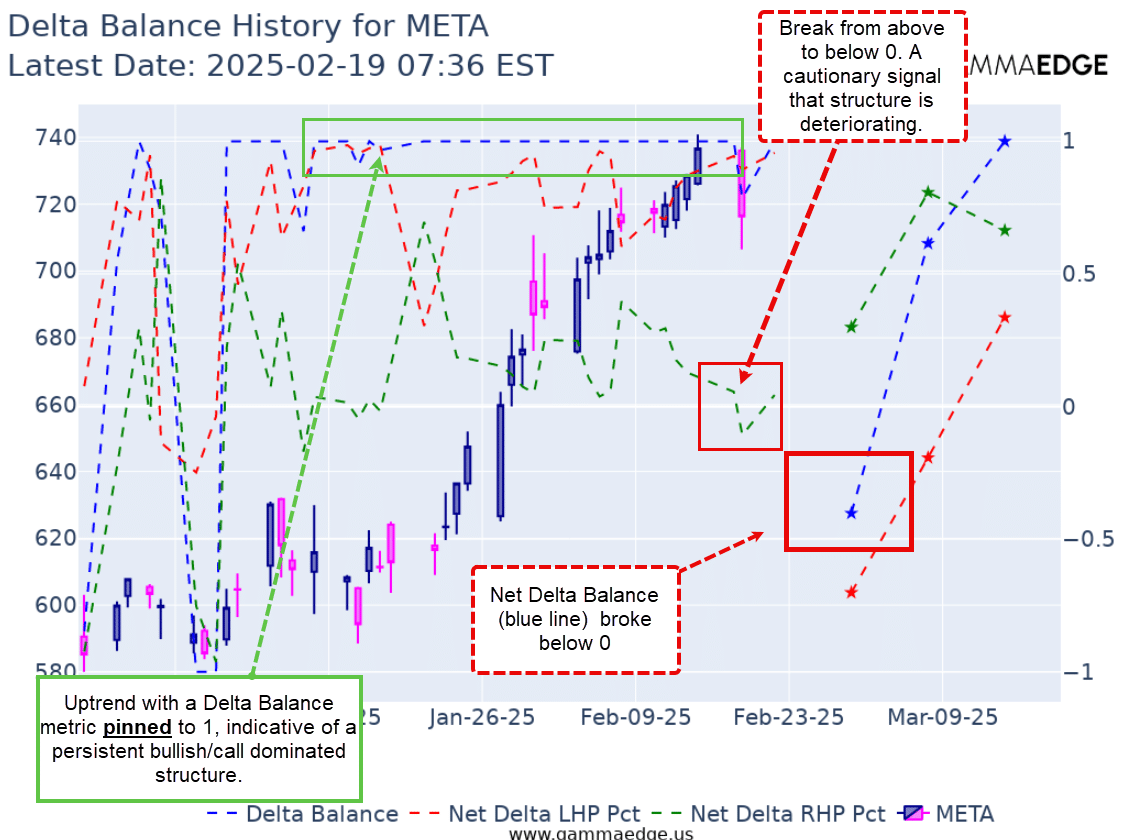
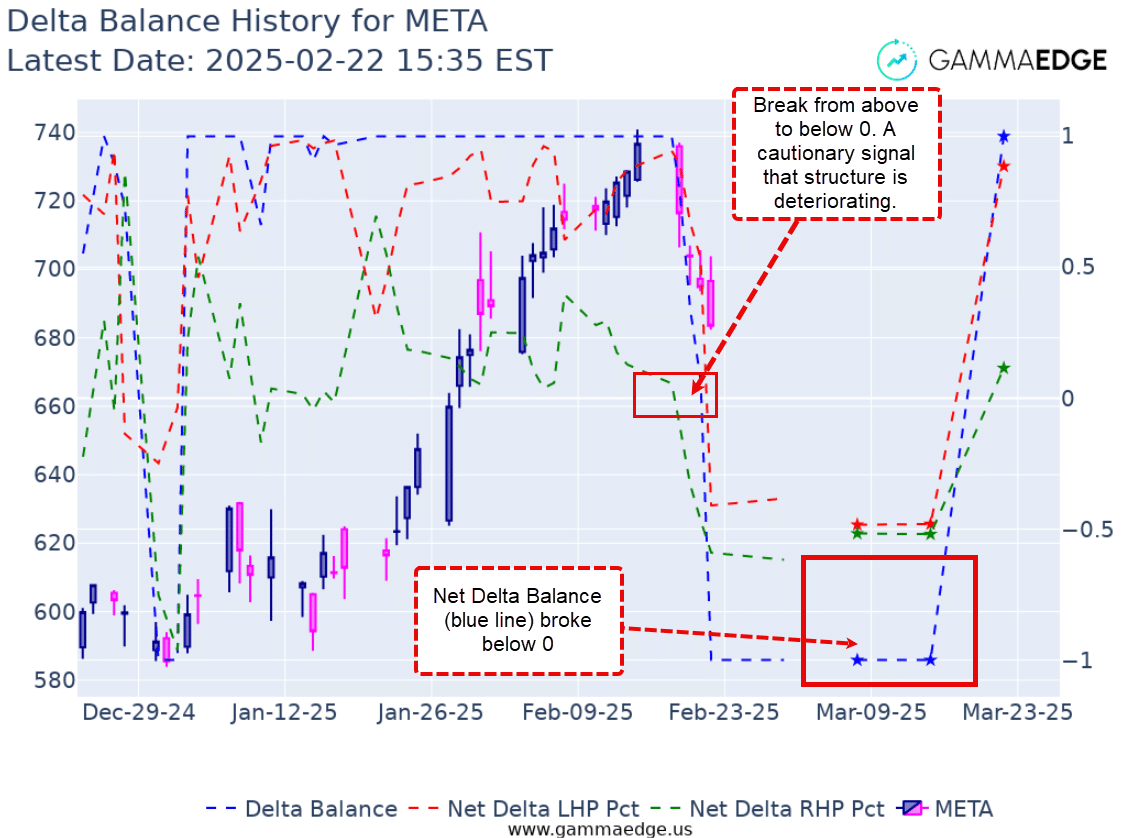
Through the 3 examples of META above, it should be clear how the future projected conditions went from pinned to 1 to pinned to -1 in short order and how $dbh helped to show this, which would have helped you sidestep or at least exit for minimal losses relative to the alternative of bag-holding.
Let’s walk through another example of how the tools work together with AAPL.
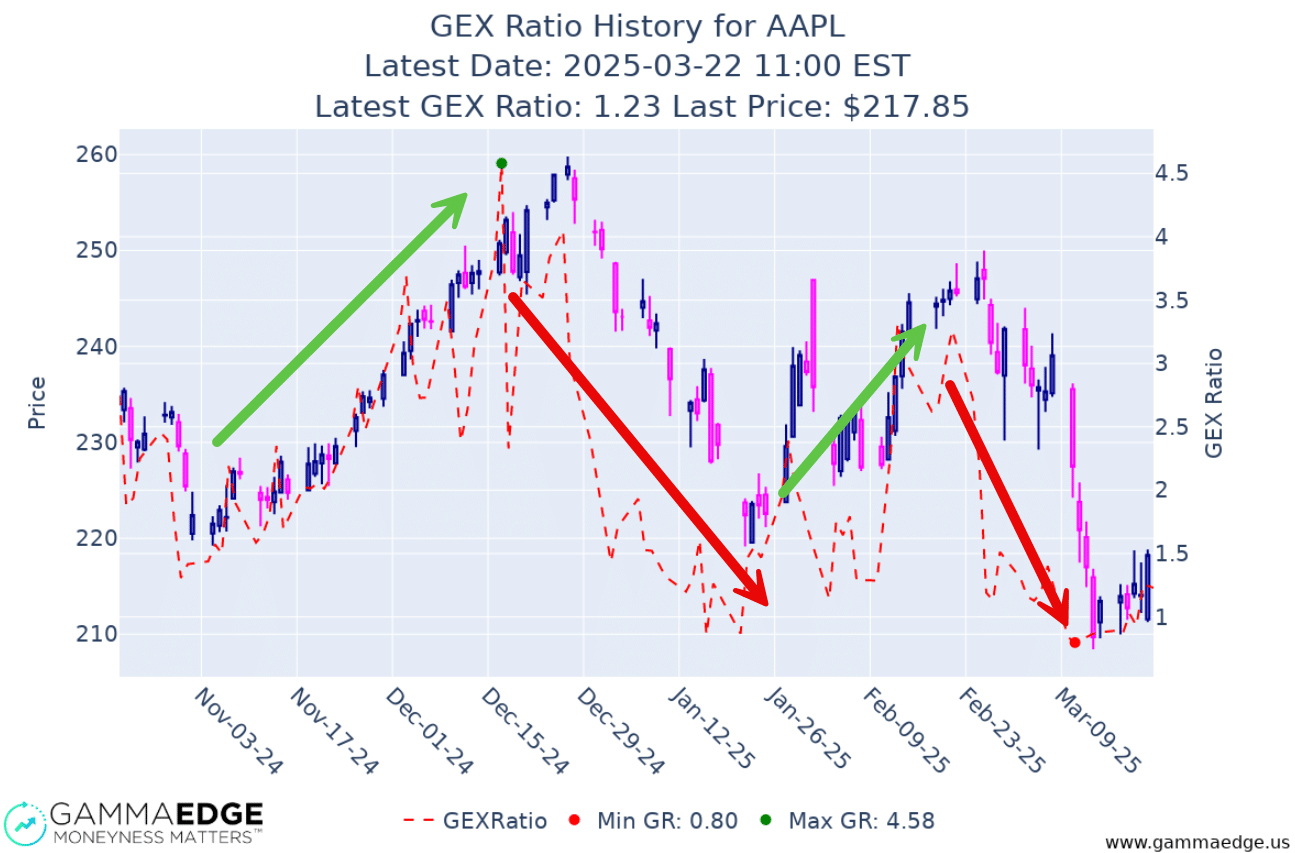
Looking at AAPL’s GEX Ratio history:
What’s particularly interesting here is how closely price followed these structural shifts. The December/January deterioration (as well as the February 2025) in GEX Ratio preceded and accompanied significant price weakness – precisely what we want to spot early. Note the green dot on GEX Ratio – this is the local high, and it took about two weeks to reach a price high. By the time the price reached the high, GEX Ratio had started to decline, telling you the market was positioning for less upside / greater downside.
This occurred again in the middle of February 2025. Price bounced from the January 2025 decline but the GEX Ratio then again sharply fell ahead of the eventual price decline throughout February and into March 2025.
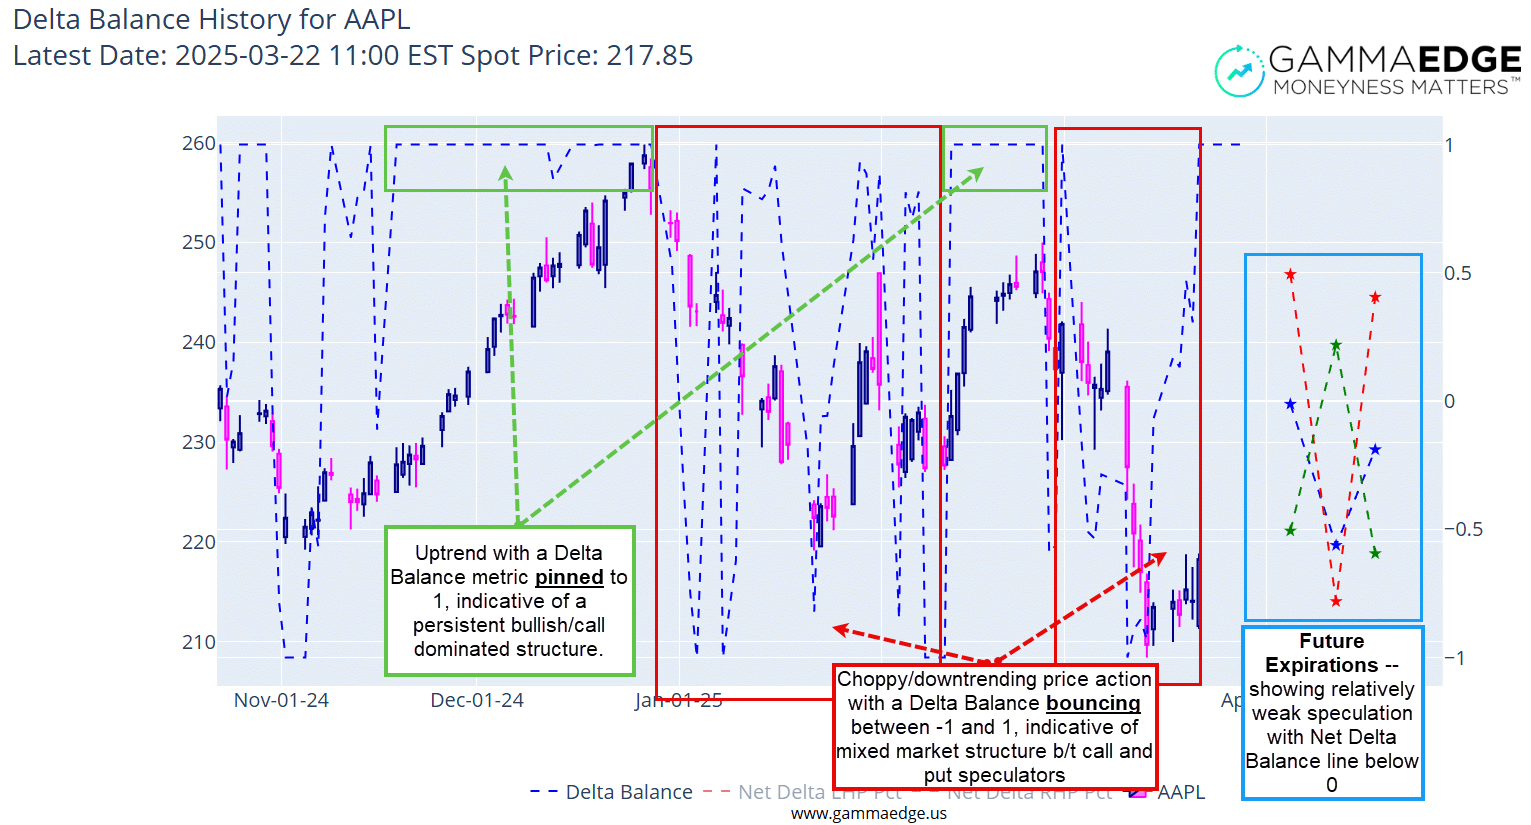
The Delta Balance command adds another layer of confidence to our analysis from above.
During the December 2024 Uptrend:
Mid-December 2024 through January 2025 Deterioration (and again in Late February through March 2025):
Trading without understanding market structure is like driving without GPS – you might eventually get there, but you’ll likely take some wrong turns along the way.
The GEX Ratio and Delta Balance tools act as your market structure GPS, helping you:
Remember, every trading day is a battle between call and put speculators. These tools let you see who’s winning that battle and if their advantage is growing or shrinking – putting you on the right side of structural moves before they happen.
If you want a video breakdown of the above, just click here.
Want to learn more about using market structure analysis to improve your trading decisions? Our FREE flagship education course, The GammaEdge Framework, walks you through our entire trading methodology, fully unlocking the power of options market analysis for your trading toolkit:
Note: The examples shown in this article are from past dates and don’t reflect current market conditions. Be sure to analyze current data for your trading decisions.