%201.avif)

Selling Covered Calls: The GammaEdge Strategy
.png)
Taylor Drake
.png)
December 12,2025
.png)
15mins read

You’ve been selling covered calls for months, maybe even years. You’ve got your system down – pick strikes 5-10% out of the money, maybe follow the 45-day rule, collect premium, and repeat.
It’s working. You’re generating a steady income from your long-term holdings. But what if there was a way to get even better at it?
Here’s what most covered call sellers don’t realize: the options market is constantly revealing where profit-taking pressure naturally occurs. While you’re focusing on time decay and arbitrary strike selection, there’s an entire layer of intelligence (through understanding positioning within the options market) you can use to pick strikes where natural resistance exists.
We’re not talking about replacing your existing selling covered calls strategy. If the 45-day approach works for you, keep using it.
This is about enhancing your strike selection by understanding where call speculators concentrate their activity – and where they’re most likely to take profits.
Instead of selling strikes based on percentages, you can sell them based on where market structure creates natural selling pressure.
The options market constantly signals where profit-taking is most likely to occur. You just need to know what to look for.
Enter +GEX – one of GammEdge’s most powerful structural levels.
+GEX stands for “Positive Gamma Exposure” and represents the strike with the highest concentration of call gamma in the entire options complex. Think of it as the price level where the most short-term call speculation is concentrated.
Here’s the key insight: +GEX isn’t just a random data point – it’s where human psychology kicks in.
When traders buy out-of-the-money calls, they’re risking the premium they paid for the potential of significant profits. Say a stock trades at $100, and +GEX sits at $120. Those call buyers are targeting $120 as their key profit level – where they expect maximum benefit from their position.
Once price reaches $120, something powerful happens. Those speculators have hit their target level where maximum convexity occurs. Their calls have experienced rapid price appreciation as they’ve moved from out-of-the-money toward at-the-money, and human nature kicks in – they want to lock in those gains.
This creates what we call a “monetization zone.” When price approaches +GEX levels, you’re hitting the exact spot where the largest concentration of call holders are likely to take profits – creating selling pressure that works in your favor.
For covered call sellers, +GEX provides:
Traditional approaches tell you to sell strikes 10% out-of-the-money “because that’s what works.” The +GEX approach shows you where speculative positioning already creates resistance – where human psychology (greed) generates selling pressure.
You’re working with market forces instead of fighting against them.
Key Point: GammaEdge’s +GEX is more potent than simply looking at the strike with the highest call open interest because gamma incorporates the time element, which is what +GEX is predicated on. A strike with massive call open interest expiring six months from now has minimal impact on today’s price action. But +GEX naturally emphasizes near-term options where gamma is highest – these are the positions that actually influence current price movement and create immediate profit-taking pressure.
Here’s a critical concept most covered call sellers miss: path dependency. Your success doesn’t just depend on where the stock ends up at your expiration – it depends on the journey it takes to get there.
Think of it this way: you’re planning a road trip from New York to Boston. You could take the highway straight through, or you could encounter construction zones, traffic jams, and detours along the way. The destination is the same, but the path dramatically affects your experience.
The same logic applies to covered calls. Between today and your target expiration date, there are multiple weekly and monthly option expirations, each with its own +GEX levels. These create a series of potential speed bumps or acceleration zones that can help or hurt your position and your overall thesis on the stock.
Monthly expirations typically have the most robust open interest and create the strongest +GEX signals. These are your major “destinations” – reliable structural levels where significant profit-taking occurs. Monthly expirations are normally the 3rd Friday of the month.
Weekly expirations can create additional +GEX levels between the monthlies, but they’re often weaker and can be misleading. Think of them as potential “potholes” in your path – sometimes they matter, sometimes they don’t. Most stocks and ETFs have Friday-to-Friday expirations, but there are exceptions, so be sure to check.
The key insight: The arrangement of these +GEX levels between now and your target expiration determines whether structural forces work for you or against you.
If shorter-dated +GEX levels create “stepping stones” below your strike, each one becomes a potential profit-taking zone that supports your position. If they sit above your strike, they suggest upward pressure that could lead to early assignment.
This is what we call path analysis – mapping out the structural obstacles and opportunities between today and your expiration date.
Now that you understand the theory, let’s review the two primary scenarios you’ll encounter:
The setup: Your strategy is set up for selling a 45-day call on a stock currently trading at $100.
The favorable path looks like this:
Why this is powerful: Each shorter-dated +GEX level sits below your target strike, creating “stepping stones” of natural resistance levels that should slow any advance toward your strike.
Your enhanced strategy:
The challenging path:
The problem: The shorter-dated +GEX levels are above your target strike. This means call speculation is concentrated at strikes above your position, suggesting:
Your strategy adjustment:
This way, you’re selling calls above where all the speculative activity is clustered, giving yourself a better chance of the calls expiring worthless instead of getting caught in the middle of the upward momentum.
Let’s walk through a real example to show you exactly how this selling covered calls strategy works using PLTR.
A trader is interested in selling covered calls in the September monthly expiration, which is about 3 weeks out. To map the path properly, we need to analyze all expirations between now and then:
First, let’s look at all expirations together to understand the overall structure.
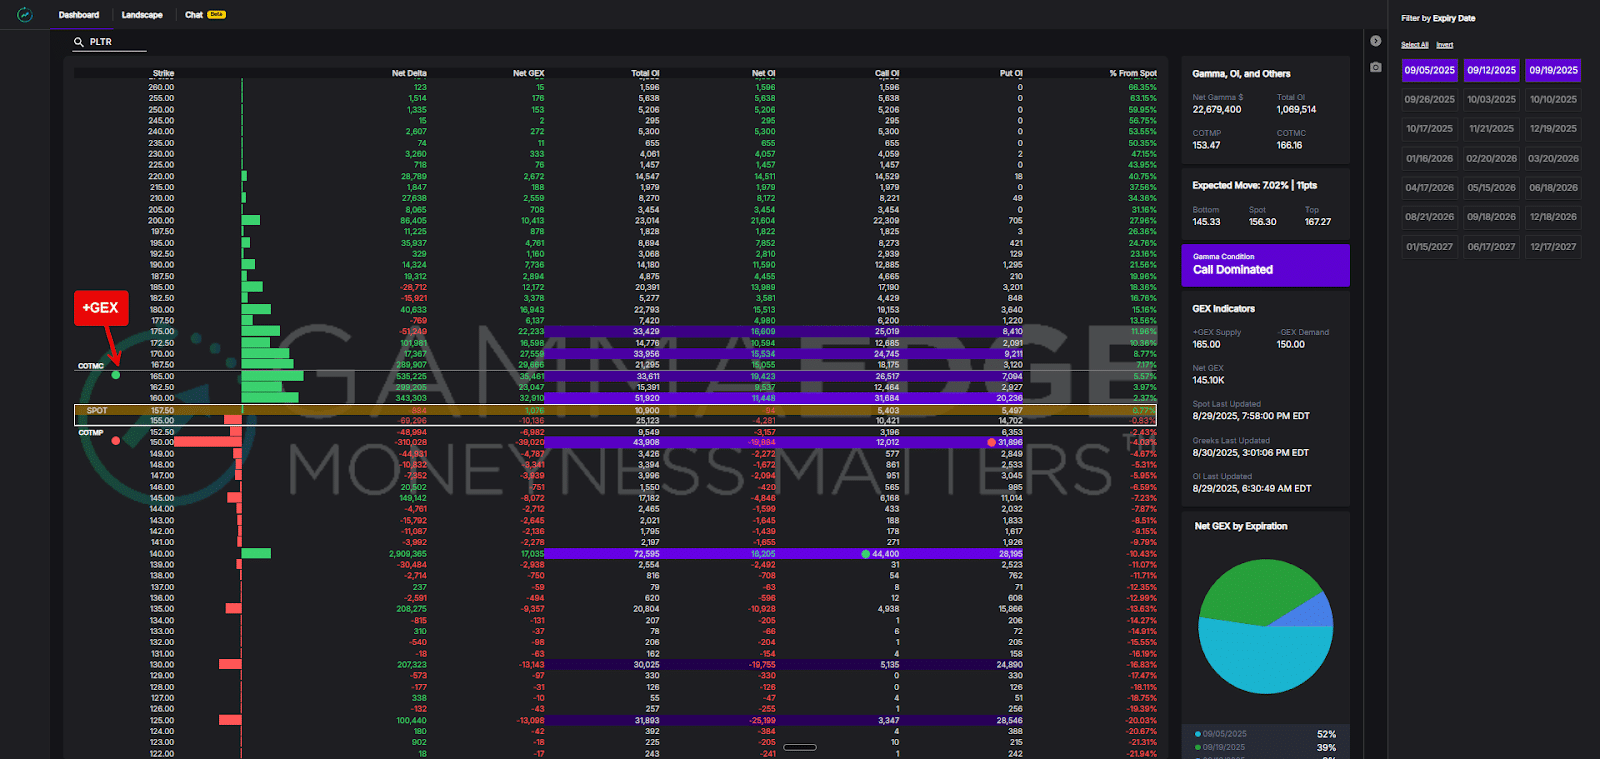
When we combine all expirations, +GEX sits at 165 – about 5.6% above PLTR’s closing price on 08/29/25. This gives us the broadest view of where call speculation is concentrated.
Now let’s examine each piece of the path to see what obstacles or support we might encounter.
Week 1 (09/05/25 expiration only):
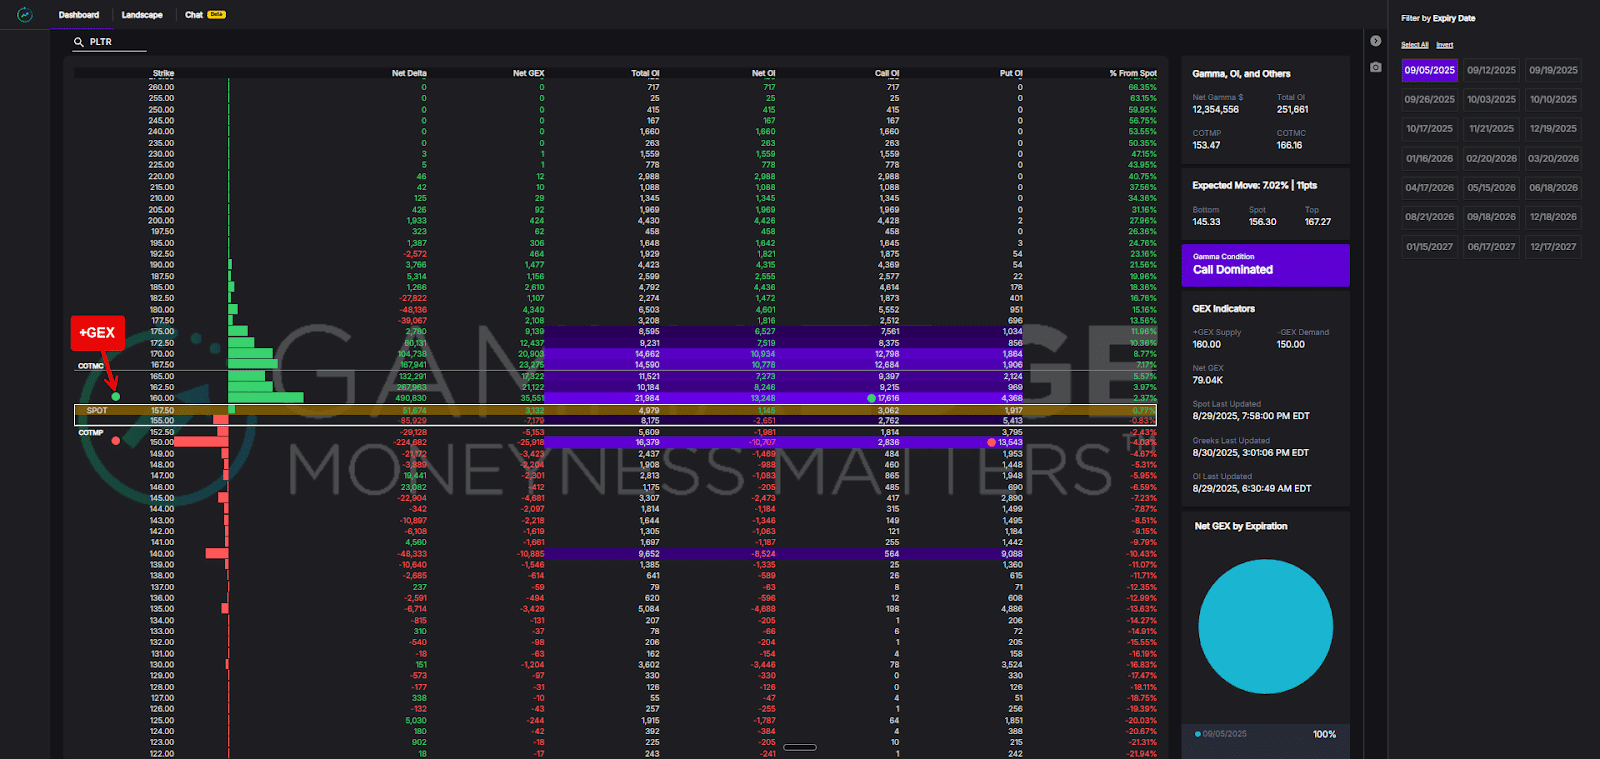
Looking at just the first weekly expiration, +GEX drops to 160. This tells us the first “speed bump” sits at 160, where we’d expect profit-taking from weekly call holders. This would support selling 165 or higher.
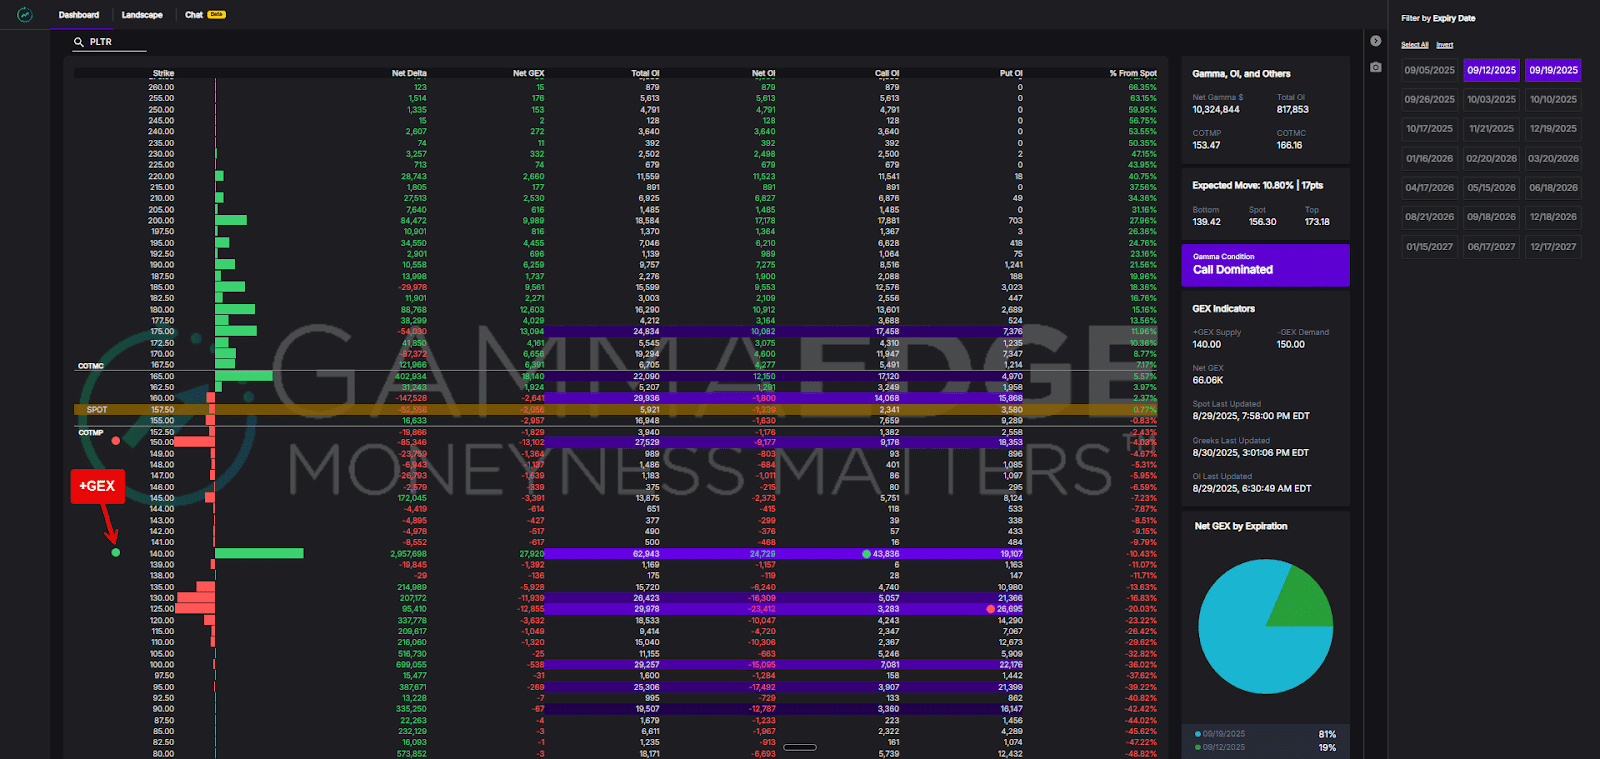
Here’s where it gets interesting. The remaining two expirations show +GEX at 140 – well below the current price. This means most of the longer-term call speculation is already in-the-money and could be monetized, creating selling pressure. Again, this would support selling the 160 or 165s today, as we expect price to move sideways to lower.
The monthly expiration alone shows +GEX at 140, confirming this is where the dominant call speculation sits for the target expiration.
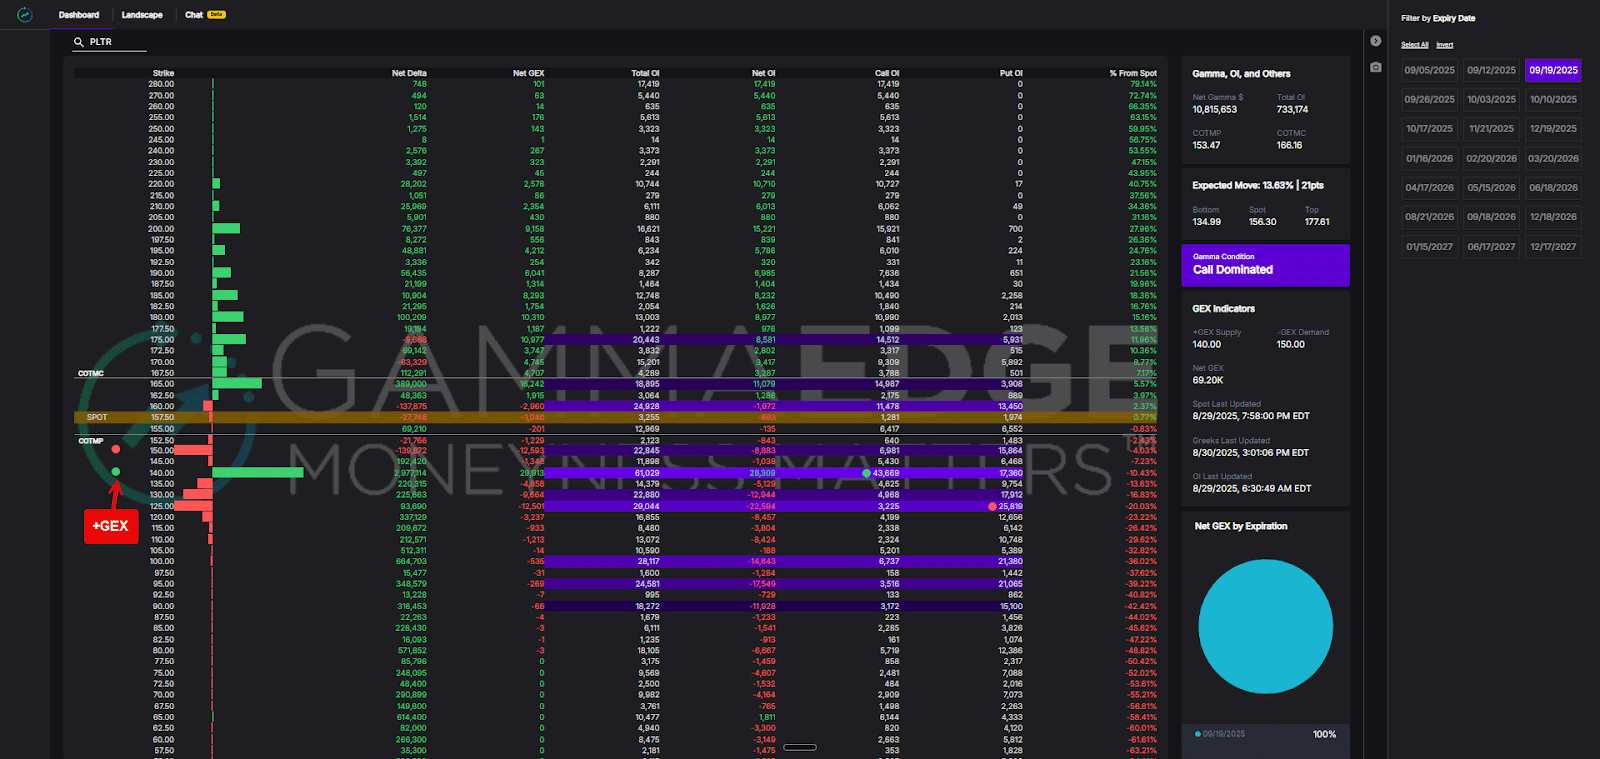
This path analysis reveals a favorable setup for selling covered calls:
Instead of blindly selling calls at some percentage out-of-the-money, this analysis shows why strikes around 165-170 make structural sense – you’re positioning above the near-term resistance with longer-term forces working in your favor.
Step 1: Pull up the GammaEdge Web App Dashboard
Step 2: Map Your Path
Green Light Setup (Favorable Structure):
Yellow Light Setup (Mixed Signals):
Red Light Setup (Challenging Structure):
Let me address the most frequent objections and questions about this approach:
I get it – selling covered calls are supposed to be simple income strategies. But here’s the thing: you’re already analyzing to pick your strikes and expirations. This just adds one layer of market intelligence to improve those decisions.
Think of it like checking the weather before you leave the house. You don’t need to become a meteorologist, but knowing if it’s going to rain helps you make better decisions about what to wear.
The core workflow takes 10 minutes in the morning. That’s less time than most people spend checking their regular positions.
+GEX levels indicate where speculation is currently concentrated – they’re not predictions about what will definitely happen. They’re probability indicators, not guarantees.
However, what makes them valuable is that they’re based on real money from real traders. When thousands of call buyers position themselves at a specific strike, it creates genuine supply and demand dynamics that traditional technical analysis can’t see.
Even when levels “fail,” they often provide early warning. If price blows through multiple +GEX levels without any resistance, that tells you something important about the strength of the move.
This is where the GammaEdge platform becomes valuable. We’ve built these tools specifically because most retail platforms don’t provide this level of options market intelligence.
You can access our WebApp Dashboard and command-line tools to get this structural analysis, then execute your trades through whatever broker you prefer. Think of it as using professional-grade market analysis with your existing execution platform.
Major news events can certainly overwhelm structural levels – earnings announcements, Fed decisions, and company-specific news can blow right through +GEX resistance.
This is where position sizing and risk management become crucial. During high-volatility periods, consider:
The structural approach works best in normal market conditions, not during major disruptions.
The power of this methodology comes from understanding human behavior at scale. When you sell a covered call, you’re not just betting against one person – you’re positioning yourself relative to thousands of traders who’ve made similar bets.
Traditional approaches focus on time and probability. They’ll tell you that options X days out-of-the-money have a Y% chance of expiring worthless based on historical patterns.
The structural approach focuses on actual positioning and psychology. It shows you where real traders have placed real money and where their natural profit-taking behavior will create resistance.
This isn’t about replacing sound principles like time decay and probability – it’s about adding market intelligence that helps you apply these principles more effectively.
As you use this approach over time, you’ll notice several improvements:
More strategic positioning – Working with market forces instead of hoping they don’t matter
The most important thing you can do right now is start observing. Before changing anything about your current approach, spend time simply tracking +GEX levels for your existing positions or stocks you’re considering.
Remember, this isn’t about becoming a different type of trader overnight. It’s about becoming a better version of the trader you already are – one who understands the structural forces that most market participants never see.
The goal is simple: transform from someone hoping your strikes don’t get hit to someone who understands the market forces that determine whether they will or won’t.
Start small, stay consistent, and let market structure guide you toward better covered call results. Your future self will thank you for adding this layer of intelligence to your trading toolkit.
Until next time,
Taylor
GammaEdge Co-Founder