%201.avif)

Master Market Structure Analysis: How To Use NetStat to Anticipate Price Moves Through Delta, Gamma, Charm, and Vanna
.png)
Taylor Drake
.png)
December 12,2025
.png)
15mins read
There are two types of SPX 0DTE traders:
While charts can show you what’s happening, they can’t reveal why price might suddenly accelerate or reverse. That’s where option Greek exposures become critical – they uncover the hidden forces creating powerful market moves.
In this guide, we’ll break down our NetStat (“NET Greek STATus”) tool, which transforms complex Greek forces into clear, actionable trading levels that reveal critical market structure before price movements occur.
Think of NetStat as your market structure dashboard – a comprehensive snapshot of how four core option Greeks influence price movement at any point in time:
For example, when a large concentration of out-of-the-money (OTM) calls suddenly becomes in-the-money (ITM), market makers must adjust their hedges quickly, often accelerating price movement. NetStat helps you spot these potential acceleration points before they happen, rather than reacting after the move.
Instead of drowning in complex calculations, NetStat presents this information in a simple table that reveals:
Understanding this “chess board” of market structure is crucial because it shows both the distribution and concentration of positioning, which directly impacts potential price movement. This insight is especially powerful for SPX 0DTE trading, where these forces play out within a single session.
At GammaEdge, we offer 3-D surface models for each Greek (delta, gamma, charm, and vanna). NetStat’s power lies in its ability to distill key information from these complex 3-D models into one snapshot table. While it doesn’t provide all the granular details of the full models, NetStat offers an excellent summary of the four Greeks and key sensitivity points within the market structure.
NetStat is most valuable for understanding how the dominant moneyness (ITM or OTM) above and below spot price influences the options complex. Specifically, NetStat reveals:
This information helps identify whether the market structure provides bullish tailwinds (call dominance) or bearish headwinds (put dominance).
Delta is the only “first-order” Greek and serves as the primary measurement of risk that market makers hedge. Simply put, delta measures how sensitive your position is to movements in the underlying asset (e.g., SPX).
NetStat helps you identify:
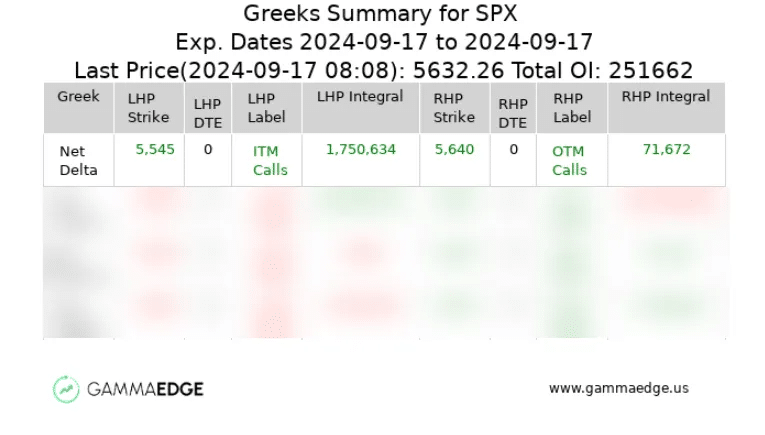
Let’s examine what a NetStat output might tell us about market structure:
Above Spot Price (RHP):
Below Spot Price (LHP):
The big picture? Calls (long deltas) are firmly in control of the structure above and below the current price – a bullish setup. The 5640 strike is particularly important to watch as crossing it from below could trigger accelerated upward movement due to the OTM-to-ITM shift in those calls and the subsequent influence on the Dealer’s hedging.
Here’s a video further explaining Delta’s importance.
Charm is a “second-order” Greek that influences Delta through the passing of time.
As time passes during the trading day, Delta changes even if spot price stays flat or volatility remains constant. This is where Charm comes in. Understanding Charm exposure helps you anticipate:
It’s important to remember the following:
With this in mind, a quick cheat-sheet is the following:
This is the exact influence of Charm, and we have to remember that this limit or decay component is always present.
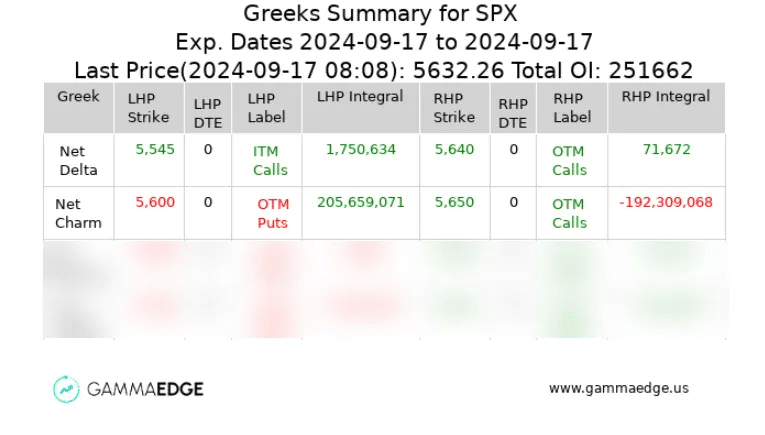
Revisiting our earlier example:
We showed above that for the Net Delta row, ITM Call delta significantly outweighs OTM Put delta activity in the LHP. This is shown by the green LHP Integral value of 1,750,634.
The second row, which is Net Charm, shows that we have a very large dominant strike in the LHP at 5600. We also see that the LHP consists of Net OTM Puts. This may be counter-intuitive: how can the LHP have an ITM Call dominance (Net Delta) but have an OTM Put dominance (Net Charm)?
The answer has to do with moneyness. Once a long ITM call has hit Delta = +1, it has no more charm to give. Deep ITM calls fall into this category – they have limited to Delta = +1. Charm in this case, where the option Delta = +1, is zero – there is no further change in delta due to time for that option.
In this case, because the LHP contains both ITM Calls and OTM Puts, we have a situation where the OTM Puts are decaying towards 0 from a negative value, and their decay – in aggregate, is creating more positive charm flow than the ITM Calls. This is why the LHP label shows “OTM Puts” – the ITM Calls have already limited to +1, and all that is left are decaying OTM Puts.
The OTM Puts in the Net Charm LHP will, by definition, decay as the day progresses towards expiry. We would expect, with a steady price, that the 205,659, 071 value shown in the LHP Integral will drop.
The RHP Net Charm side can be considered just like we did for the LHP side. Here, we have dominant OTM Calls that are decaying, hence, the -192,309,068 (red) negative value.
BOTH of the Net Charm components, the LHP and the RHP, are comprised of Net OTM options, so they both will get smaller as the day progresses. On the other hand, if one of these was dominant with an ITM option (ITM Calls in the LHP or ITM Puts in the RHP), we expect Net Charm to increase for that ITM side as we move towards expiry.
In the scenario above, assuming all else equal:
The NET of the LHP Charm Integral and RHP Charm Integral is often where we see price fail to decline (LHP Net Charm > RHP Net Charm) or we see price fail to advance (RHP Net Charm > LHP Net Charm).
In our example above, the balance goes towards some support, but because these are DECAYING, the support is getting weaker and weaker as the day progresses.
Do you see how Delta and Charm interrelate and why they’re crucial to understanding?
Here’s a video further explaining Charm influences in our trading.
Gamma is another second-order Greek that influences Delta through a change in spot price.
When price moves through key Gamma strikes, Delta can change rapidly – think of Gamma as your market accelerator. Through NetStat, we can identify these potential acceleration points:

Using the same example above, large Gamma sits at strike 5640 above spot price. If price starts moving upward through this level, we could see an acceleration higher as:
It’s worth noting in the NetStat table above that there is also a large Gamma strike down at 5600. You’ll also note that the current spot price of 5632 is closer to the upper Gamma strike of 5640 than it is the lower Gamma strike of 5600. Gamma is sensitive to spot price, and the closer the spot price is to a Gamma strike, the larger the gamma at that strike.
If the price were to drop towards 5600, we would see the put-dominant 5600 strike grow in negative gamma and the upper 5640 strike drop in positive gamma.
This is how it works: Gamma has a magnifying impact on the strikes around it, which is usually important to your trading and understanding of market structure analysis.
Here’s a video further breaking down Gamma’s importance.
Vanna is the last second-order Greek that influences Delta through a change in volatility.
While Gamma shows how Delta changes with price movement and Charm shows how Delta changes with time, Vanna reveals how Delta changes with volatility.
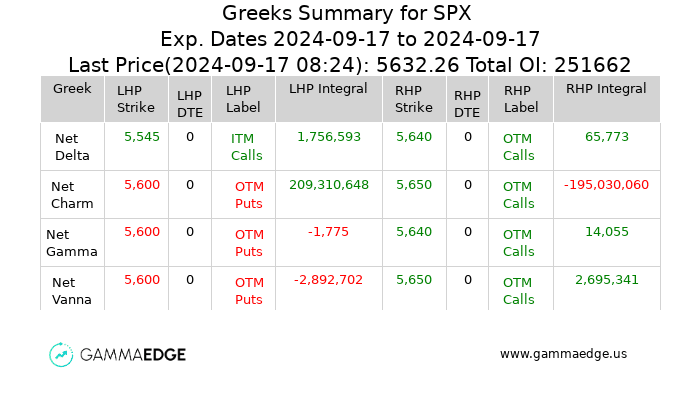
The NetStat table above gives us a view of Vanna’s influence on Delta. As price falls towards the 5600 strike, we would expect the LHP Integral to grow in magnitude and simultaneously, we’d see a drop in the RHP integral as we moved away lower from 5650.
Like Charm, the integral balance of Vanna is often important. The NetStat table allows us to mentally sum the LHP and RHP integrals together, and as shown, there is a net negative impact on Delta. At the current volatility levels, deltas are being removed from the complex, making the overall complex shorter and all-things-equal, slightly tilting the tables more bearish.
You probably see something in the NetStat table which is different from the Charm setup: Vanna is positive in the RHP with OTM Calls and ITM Puts. This is the exact opposite of Charm and can lead to some unique opportunities.
Specifically, we want to watch for the following:
Under these conditions, think of Vanna like a coiled spring – when volatility is high and starts to contract, there is often a simultaneous move in prices to higher levels. We think the mechanics of what is happening is powerful and can be used to develop a short-covering thesis. Here’s what happens during this set of circumstances:
The NetStat tool, in combination with our VolM tool (intraday volume analysis), can help you identify the potential for a Vanna “short covering” rally.
Here’s a video further breaking down the importance of Vanna’s impact.
Remember that Delta is the foundation – Charm, Gamma, and Vanna influence Delta, but it all starts with market participants opening and closing contracts, which directly impacts Delta.
We recommend starting your trading day with NetStat:
Pro Tip: NetStat provides the structural framework of the market, showing what COULD happen based on Greek influences and price movements. Combine this with real-time tools to track what’s actually occurring in the market for a comprehensive view of market dynamics.
Trading without understanding market structure is like boxing with a blindfold – you might land some punches, but you’re missing crucial information about your opponent’s position.
NetStat removes that blindfold, showing you:
Remember: Every trading day is a battle between call and put speculators. NetStat lets you see who’s winning that battle and if their advantage is growing or shrinking – putting you on the right side of structural moves before they happen.
Want to learn more about using NetStat and Greek analysis to improve your trading decisions? Our flagship education course, The GammaEdge Framework, walks you through our entire trading methodology, fully unlocking the power of options market analysis for your trading toolkit.
You’ll discover:
Note: The examples shown in this article are from past dates and don’t reflect current market conditions. Be sure to analyze current data for your trading decisions.