%201.avif)

Identifying High Risk to Reward Trade Opportunities
.png)
Taylor Drake
.png)
December 12,2025
.png)
15mins read
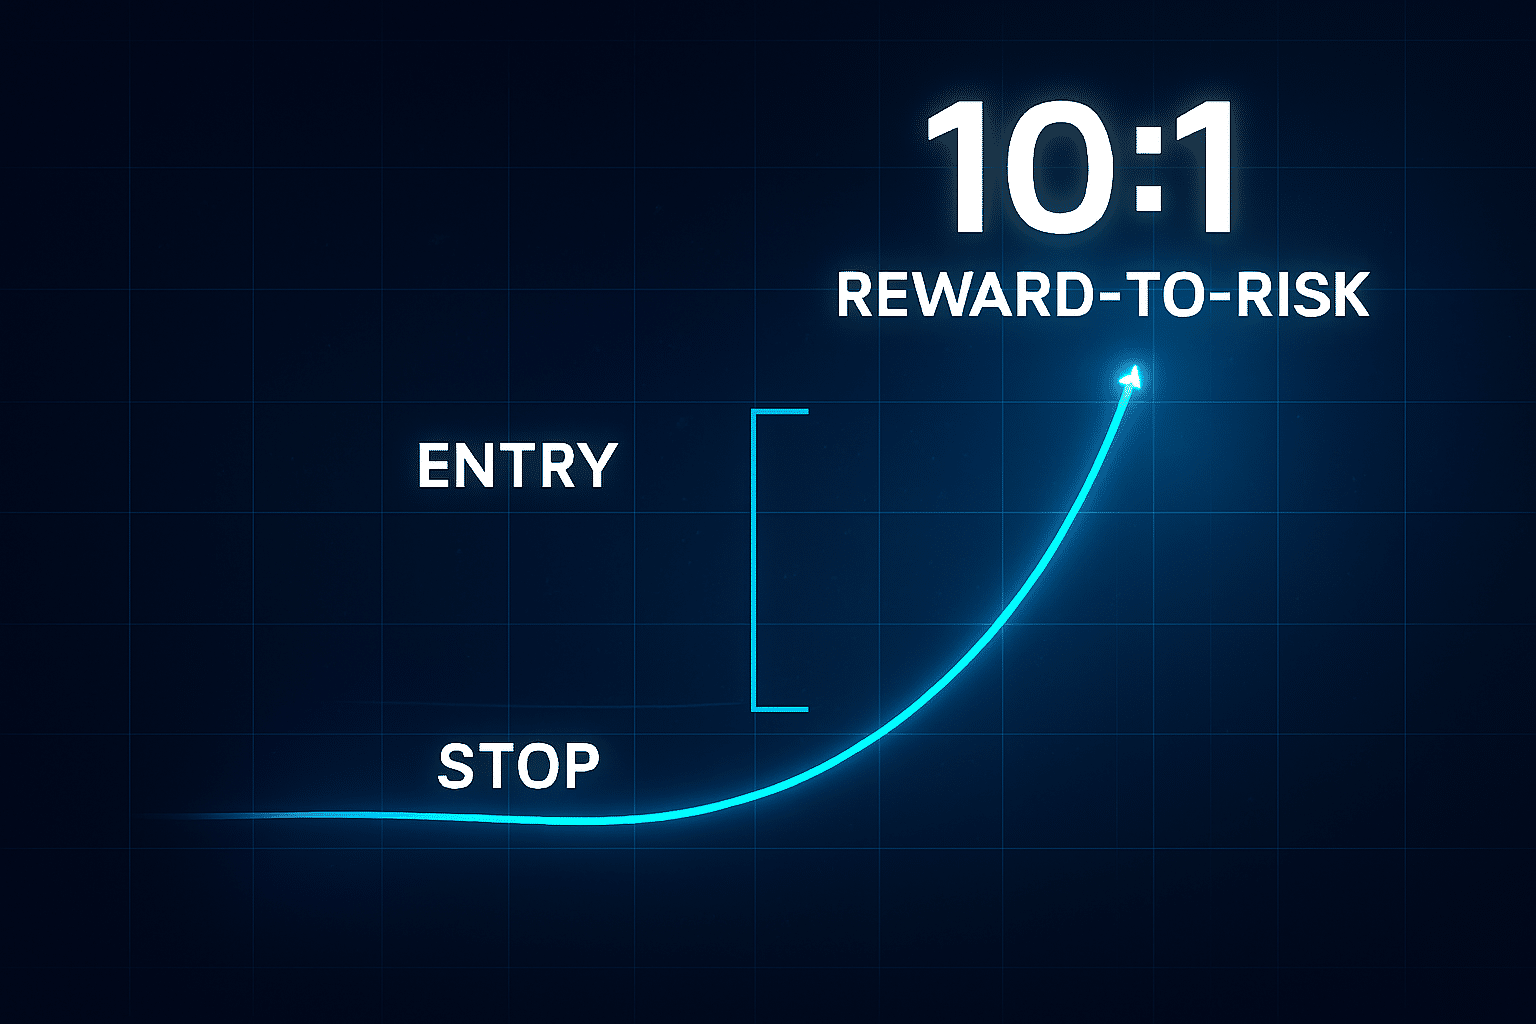
“How can I use GammaEdge tools to enable high risk to reward trade opportunities – like 1:5 or 1:10? How can I catch those volatility spikes that inflate 0DTE options?”
This question came up in our community recently, and it’s one we hear variations of constantly. Every 0DTE trader has seen those explosive moves – the ones where options go from $1.20 to $12.00 in a matter of minutes.
The frustrating part? Most traders know these high risk to reward trade opportunities exist, but they have no systematic way to identify when conditions are ripe for these moves.
Here’s what typically happens: You see SPX making a move, you jump into some 0DTE calls or puts, and you’re essentially gambling that momentum continues. Sometimes it works, sometimes it doesn’t. There’s no real edge beyond hoping you timed it right (and hope is not a risk management strategy).
But what if there was a way to identify the exact structural conditions that create these explosive moves? What if you could see where the market’s “accelerator pedals” are hidden, waiting to amplify small price movements into large option gains?
The difference between random 0DTE gambling and systematic high risk to reward trade opportunities comes down to understanding the options market structure that drives price acceleration.
Most traders focus on timing entries based on technical patterns or momentum signals (which is a great start). But given the impact & influence options markets can have on today’s modern market structure, there’s another crucial piece: knowing where the market’s structural “accelerator pedals” are located – specific price levels where dealer hedging activity can amplify small moves into explosive option gains.
This structural layer exists beneath every price chart, created by the collective positioning of options traders across strikes and expirations. When you know how to read this positioning data, you can identify exactly where conditions are ripe for those 1:5 and 1:10 moves.
Today, we’re going to break down exactly how to identify these setups using GammaEdge tools, complete with real numbers, specific strikes, and actionable strategies you can implement tomorrow.
This is crucial for finding those explosive moves because the standard open interest data most traders rely on is fundamentally incomplete.
Here’s what most traders don’t realize: the standard open interest data you see on your broker’s option chain is incomplete. It’s giving you half the story.
When you look at a strike and see “5,000 call OI” and “3,000 put OI,” most analysis stops there. Traditional thinking says:
But this ignores something crucial: the offsetting effects.
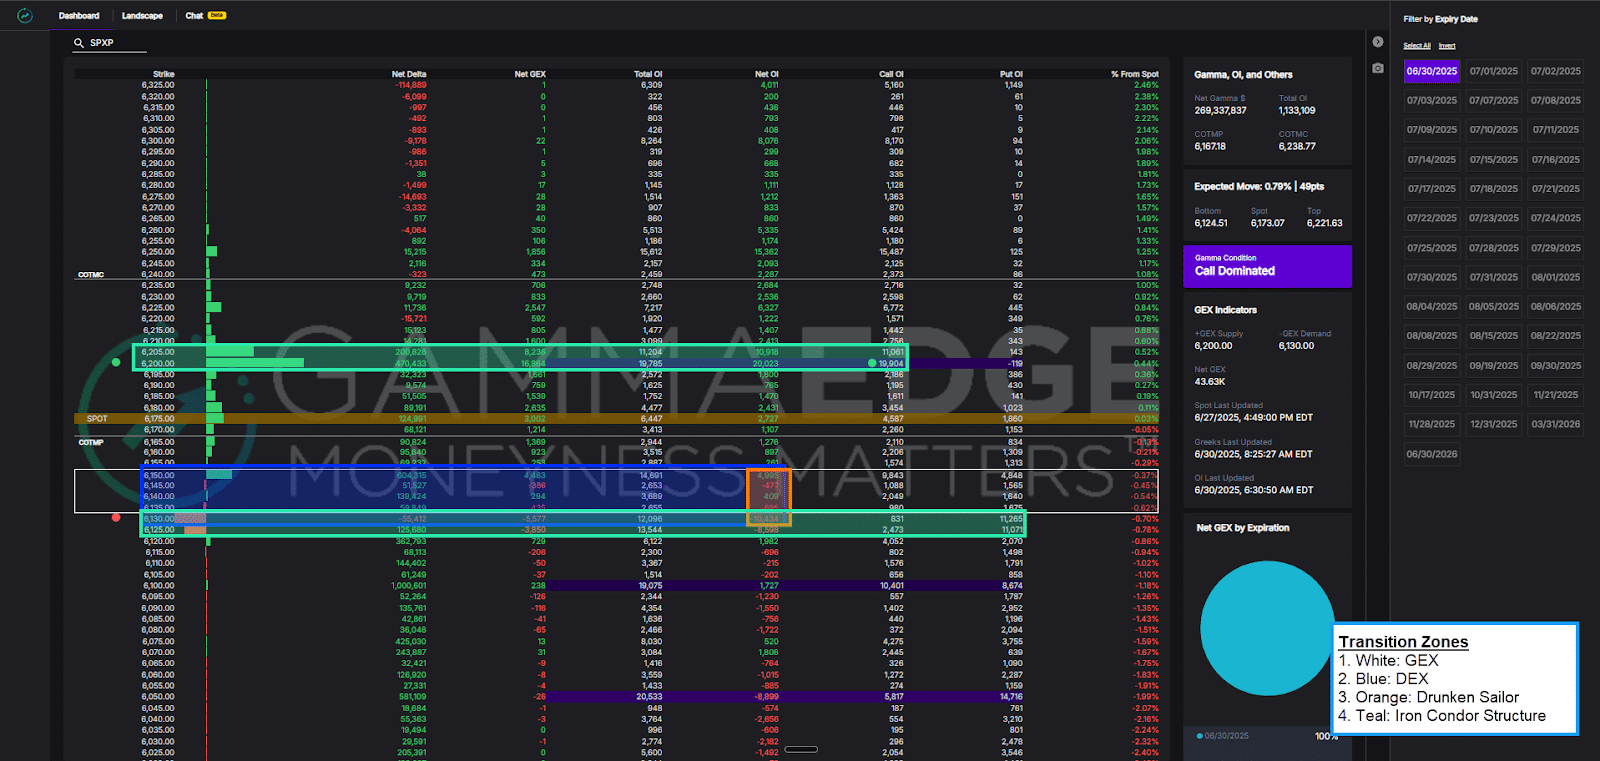
Our Net OI column (as shown in the screenshot of our Web App Dashboard below) solves this by showing you the actual synthetic positioning at each strike. Here’s how it works:
Net OI = Net Call OI – Net Put OI
The result is this:
Negative Net OI (red): Net synthetic short positioning … more puts than calls
We can do this because of put-call parity. We’re seeking the true impact at a given strike – and this is not what your brokerage reflects as the call OI or put OI. Put-call parity says that a long call plus a short put equals a synthetic long position. Similarly, a short call plus a long put equals a synthetic short position. The Net OI reveals what’s really happening at each strike level.
Here’s where it gets interesting for explosive moves:
Maximum call convexity occurs at the strikes with the highest positive Net OI. This is where gamma – the acceleration factor you need for big moves – reaches its peak as price moves across that strike.
When price approaches these high Net OI strikes, something powerful happens:
The key insight: strikes with massive gross OI (Call OI plus Put OI) but balanced Net OI (net Call OI minus net Put OI) barely react to price approaches. But strikes with large, concentrated Net OI? That’s where the explosions happen.
Let’s put finding high risk to reward trade opportunities into practice with an example, using the dashboard screenshot below of SPX 0DTE (as of 08/17/25).
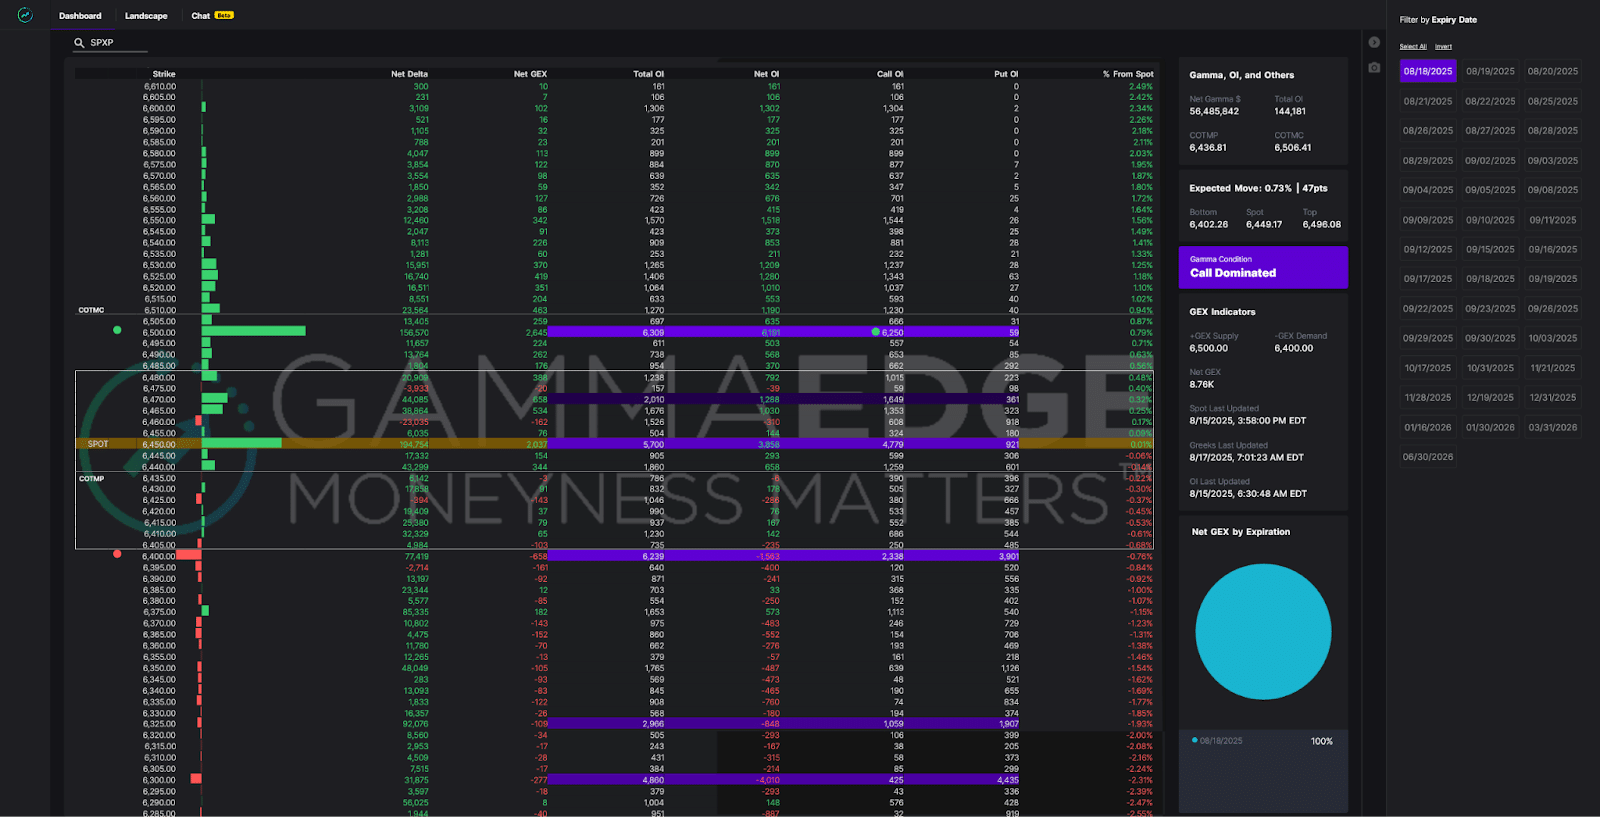
This visual tells us everything we need to know about where explosive moves are most likely to occur, and more importantly, how you can identify high risk to reward trade opportunities. Let me break down the key levels:
Current Situation:
Key Structural Levels:
PTrans (6480): This is your trigger level. Below this, price is within the transition zone, which is a low-pressure zone where dealers have minimal exposure. Price can drift within the zone without much structural influence. But once price breaks and holds above 6480, price then enters Net OI call-dominated territory where dealer hedging kicks in (and further price appreciation is expected).
+GEX/COI (6500): These are your upside target levels – where maximum call convexity sits. This strike has the highest concentration of call gamma in the entire 0DTE structure. As price approaches this level, dealer hedging pressure intensifies dramatically.
COTMC (6506): This is your resistance level – where call holders typically start to monetize their positions. Beyond this point, expect increasing profit-taking pressure.
Here’s why this structure creates high risk to reward trade opportunities:
This is your roadmap for finding those 5:1 and 10:1 trades.
Now that you understand the structural setup, let’s talk about execution. Here are three ways you could trade this framework finding high risk to reward trades, each with different risk/reward profiles:
Now that you understand the structural setup, let’s talk about execution. Here are three ways you could trade this framework, each with different risk/reward profiles:
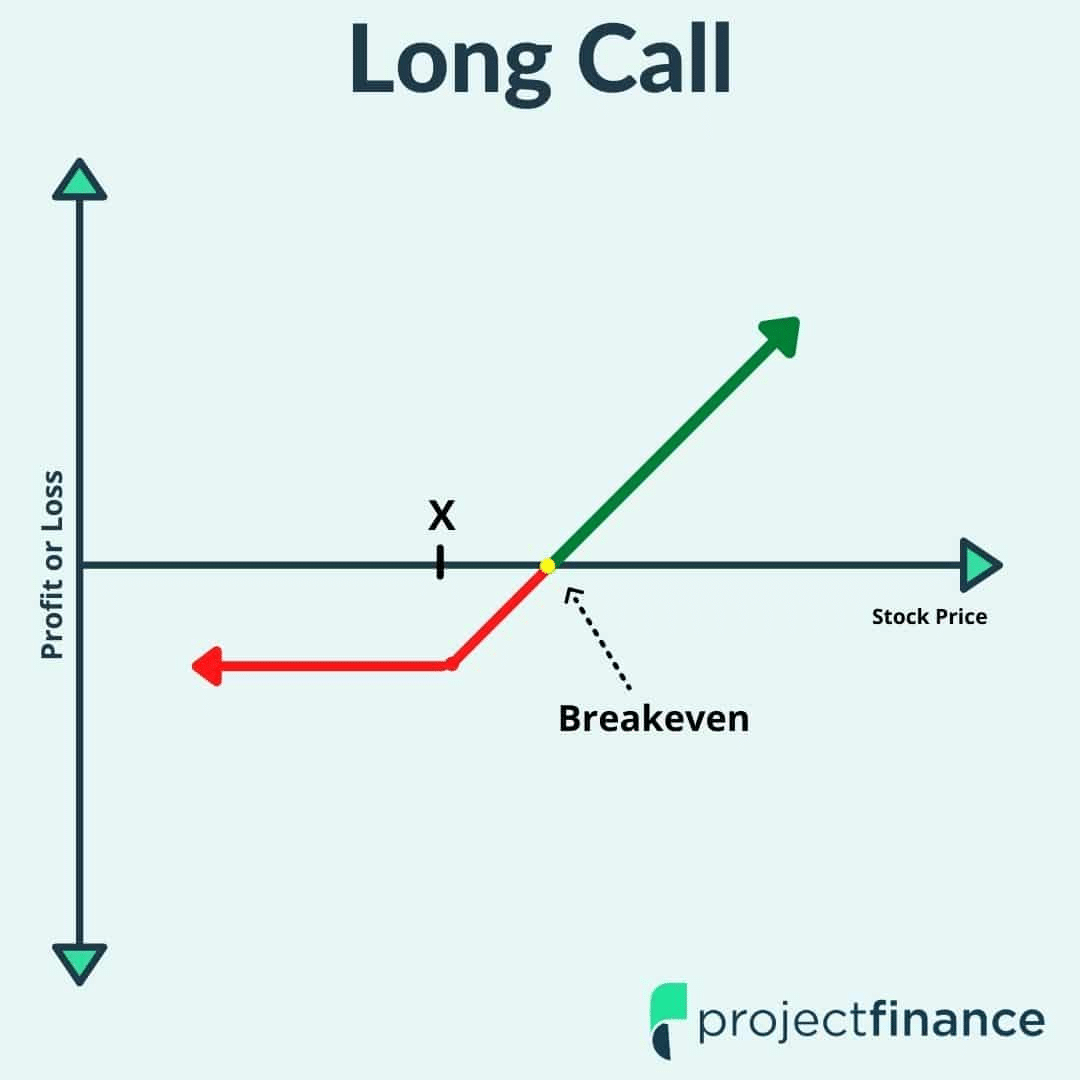
The Setup: Wait for price to break and hold above PTrans (6480), then buy (naked) calls at or just above +GEX (X in the figure is 6500).
The Trade: Long 6505 calls
Why This Works: You’re buying at the point of maximum convexity. As price moves through 6500, dealer hedging creates a feedback loop – they’re forced to buy more stock, which pushes price higher, which forces more buying.
The Risk: This is time-sensitive. If price doesn’t move quickly, theta decay will eat your premium. You’re risking the full $120 if the breakout fails.

The Setup: Same trigger (hold above PTrans), but structure it as a call spread to reduce cost and increase probability.
The Trade: 6480/6510 Long Call Spread, aka “Bull Call Spread” or Call Debit Spread (CDS) because you pay (“debit”) to enter the trade.
Why This Is Better than a Naked Call: You’re buying the acceleration (long call below 6500) while selling the resistance (short call above COTMC at 6506). You get paid for where price statistically won’t go (above +GEX/COI) to finance where it statistically will go (+GEX/COI).
Conservative Alternative: 6460/6510 Bull Call Spread or Call Debit Spread (CDS) for ~$900 cost, ~$4,100 max profit (1:4.6 R/R). This is more conservative in risk, as well as reward, because the long strike, 6460, is already in the money (ITM) and you’ll have theta working for you, instead of against you. You lose some profitability upside but increase the chance that the trade will work out if it remains above PTrans.
The Setup: Go long right at PTrans (X in the figure above is 6480) for more “stock-like” participation.
The Trade: Long 6480 calls
The Reality Check: While you’ll participate in upward moves, you need price to move 17 points just to break even. This strategy has lower and decreasing convexity but a higher probability of some profit.
All three strategies depend heavily on speed and time of day. The closer to market open you execute (assuming the structural setup holds), the more time value you capture. Wait too long, and theta decay works against you for these structures (except the conservative bull call spread with the long strike ITM, where theta helps you).
**Important Note on Risk Management**: The risk to reward trade ratios above assume you hold to expiration and lose the full premium paid. However, using GammaEdge levels gives you a clear exit signal: if price breaks back below PTrans (6480) in our example, your structural thesis is invalidated. You can exit for a partial loss rather than riding to zero, making these trades even more asymmetric to the upside than the quoted ratios suggest.
Ready to start hunting for these high risk to reward trade opportunities? Here’s your step-by-step framework for identifying and executing these trades:
Note: We prepare a detailed SPX game plan most mornings for the community. Further, while this article focuses on long SPX 0DTE examples, trades to the downside can be equally as valid for any given day based on the structure.
The beauty of this approach is that it removes the guesswork. You’re not hoping for a big move – you’re positioning yourself where market structure suggests explosive moves are most likely to occur.
Start by paper trading this framework until you’re comfortable with the mechanics, then gradually size up as you gain confidence in reading the structural signals.