%201.avif)

How to Find High-Probability Options Spread Opportunities: A Systematic Framework
.png)
Taylor Drake
.png)
December 12,2025
.png)
15mins read
Finding high-probability options spread opportunities requires a systematic approach that combines market direction analysis, candidate identification, and precise strike selection.
The most effective method analyzes options market structure—the collective positioning of all market participants—to identify where edge exists before determining how to express the trade through spreads, stock, or individual options.
Most traders understand spread mechanics. You know buying and selling options at different strikes defines your risk in a spread. The real challenge isn’t understanding what spreads are—it’s systematically identifying which opportunities actually have edge.
This requires answering three critical questions:
This is where options market structure analysis becomes critical.
By examining the collective positioning of all market participants—from retail traders to institutional desks—GammaEdge’s systematic framework identifies exactly when, where, and how to deploy spread strategies with confidence.
Most traders approach spread trading with incomplete information. Technical analysis shows you price history but misses the positioning that influences future moves. Fundamental analysis tells you about company metrics but reveals nothing about short-term options market dynamics. Sentiment indicators give you broad measures but lack the precision needed for spread strike selection.
You’re essentially scrolling through charts for hours, hoping something jumps out at you. Maybe you spot a stock near support. Maybe you see a breakout pattern forming.
But you’re still guessing:
Without understanding options market positioning—how all participants are collectively positioned—you’re making spread decisions in a vacuum.
You don’t know whether conditions favor buying direction with a call option spread or selling premium with a put option spread. You can’t tell which underlying assets have the best risk/reward setup based on where options activity is concentrated. And you’re placing strikes based on round numbers or arbitrary technical levels without knowing if they align with significant options market positioning.
The result? You might execute twenty options spreads and have no idea why three worked and seventeen didn’t. There’s no repeatability. No system. Just hope that your chart reading or gut feel was right this time.
Options market structure analysis doesn’t compete with your technical or fundamental analysis—it complements it. You’re adding a critical layer: understanding where the collective options market is positioned and how that positioning influences price action.
When you know that a stock is breaking through a key transition level with call dominance building above and below current price, you’re not guessing anymore about your setup.
When you see exactly where gamma exposure creates resistance or acceleration zones, the strike selection becomes obvious.
When the Market Trend Model shows you in which direction overall market momentum is headed, your trade is aligned with the market’s trend, not fighting against it.
This transforms options spread trading from educated guessing into systematic opportunity identification.

GammaEdge’s methodology follows a logical progression that eliminates guesswork from options spread trading:
Step 1: Determine direction of market’s momentum
Step 2: Identify candidate stocks positioned for moves
Step 3: Execute your options spread with precision using key options market levels
Each step builds on the previous, creating a complete system for options spread opportunity identification. You’re not skipping ahead to pick stocks before understanding market direction. You’re not placing options spread strikes before knowing where significant positioning exists. Everything flows in order.
Before identifying individual options spread opportunities, you need to understand the broader market environment. Are you hunting for bullish call option spread setups or bearish put option spread opportunities? Should you be looking for upside momentum or downside pressure for your options spreads?
Most traders skip this step. They jump straight to screening stocks for options spreads, which means they’re fighting the prevailing market current half the time. The Market Trend Model reveals the underlying buying and selling pressure across multiple timeframes, showing you whether the market has a tailwind or headwind for options spreads—and which direction it’s blowing.
The GammaEdge Market Trend Model (MTM) is built off the Tick Index, which tracks actual transaction flow. Every time a trade pushes price up, that’s an uptick. Every time it pushes price down, that’s a downtick. The Cumulative Tick (CT) compiles these throughout the session, creating a real-time measure of buying versus selling pressure that informs your options spread decisions.
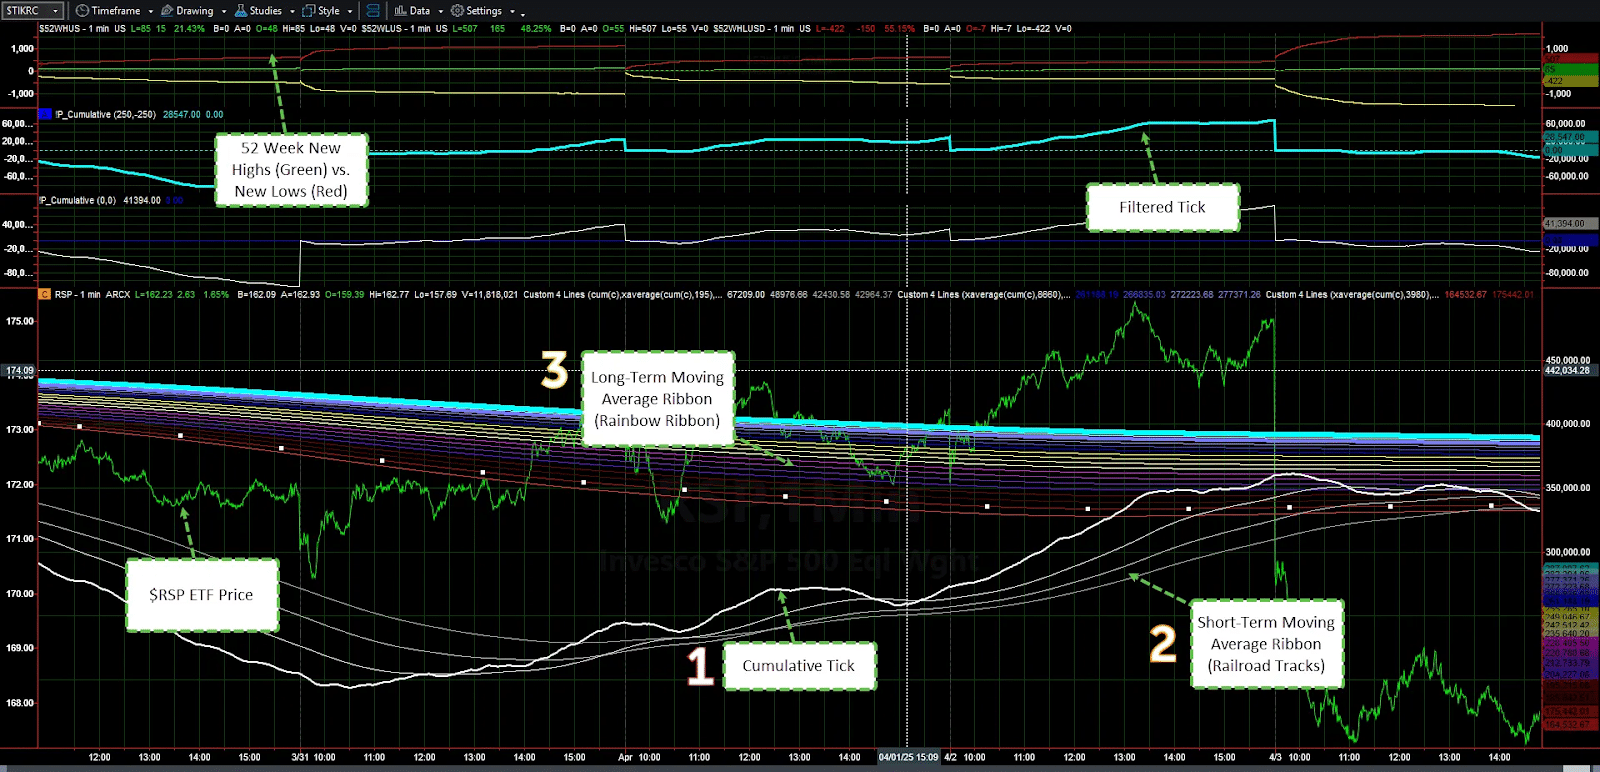
The MTM shows you three timeframes at once:
Most traders skip this step. They jump straight to screening stocks for options spreads, which means they’re fighting the prevailing market current half the time. The Market Trend Model reveals the underlying buying and selling pressure across multiple timeframes, showing you whether the market has a tailwind or headwind for options spreads—and which direction it’s blowing.
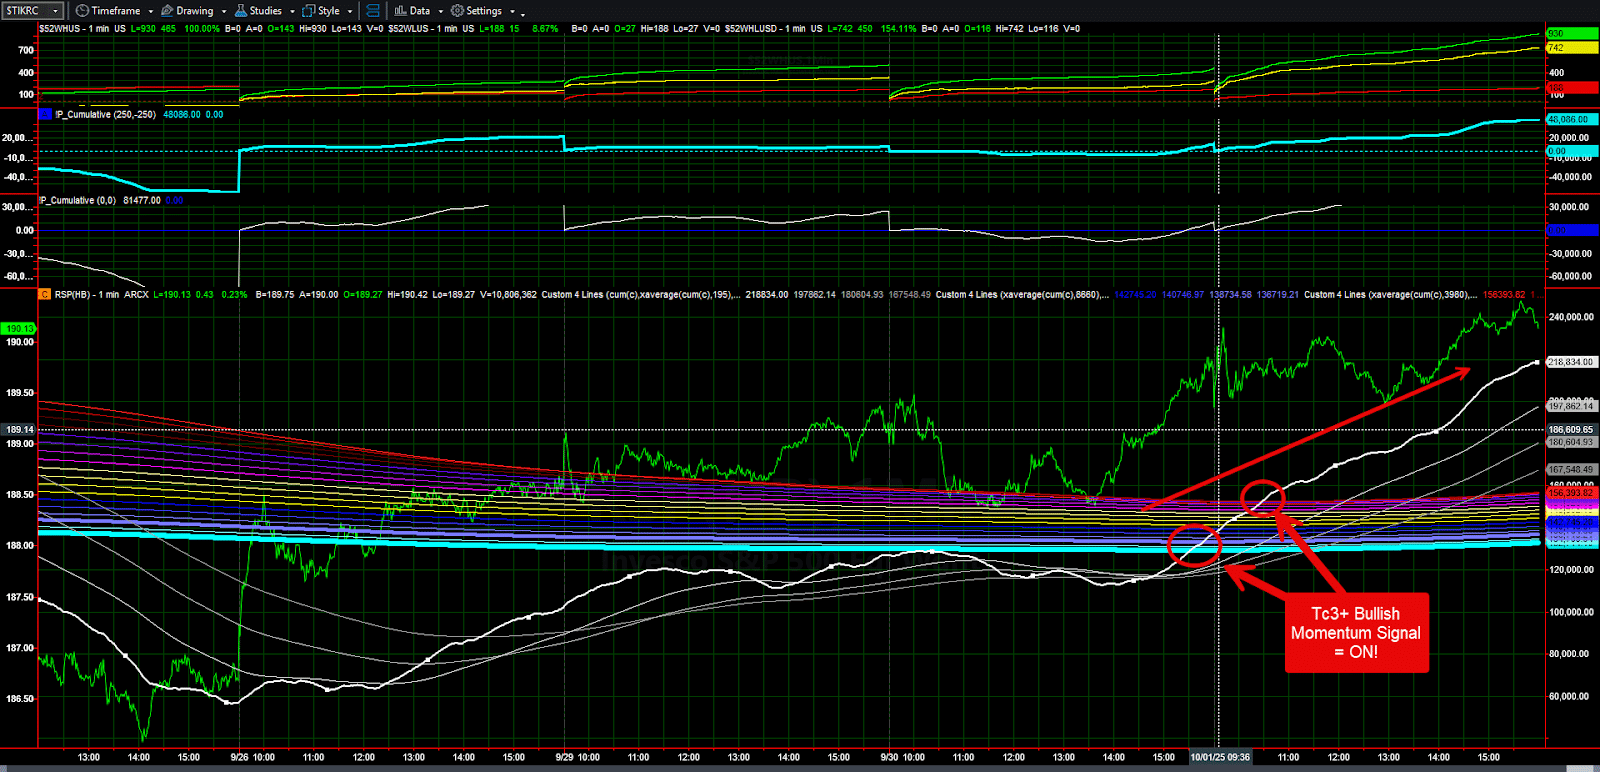
When you see TC3+ signaling bullish, here’s what’s happening for your options spread opportunities:
This tells you the market environment favors bullish options spread opportunities. You should be running bullish scans and looking for stocks positioned for upside moves suitable for call option spreads.
When TC3+ is not signaling (neutral or bearish conditions):
The GammaEdge Solution: One 30-second glance at the Market Trend Model tells you whether you’re running bullish scans or bearish scans today. No gut feel. No guessing. Just clear directional context based on actual buying and selling flow in the market.
You’ve checked the Market Trend Model. TC3+ is bullish. You know the environment favors upside moves. Now what?
Most traders open their platform and start scrolling through charts, through watchlists, through screeners showing hundreds of stocks for potential options spreads.
Maybe something catches your eye. Maybe you waste 45 minutes and find nothing. There’s no system for identifying options spread opportunities—just hope that you spot something good.
GammaEdge scans do the heavy lifting for you. Instead of scanning for generic technical patterns, these scans incorporate options market structure data to surface stocks where positioning creates edge.
Specifically, the scans identify stocks based on call dominance (for bullish setups) or put dominance (for bearish setups)—measuring where options activity is concentrated relative to the current stock price. When you see call dominance building both above and below the current price, you’re looking at a stock where the options market is positioned for upside. When you see put dominance, the market is positioned for downside.
When the Market Trend Model shows bullish momentum, you run:
What This Reveals: These scans surface stocks where options market participants are positioned for upside moves. You’re not guessing which stocks might rally for your call option spread—you’re seeing which ones already have the positioning that typically precedes rallies.
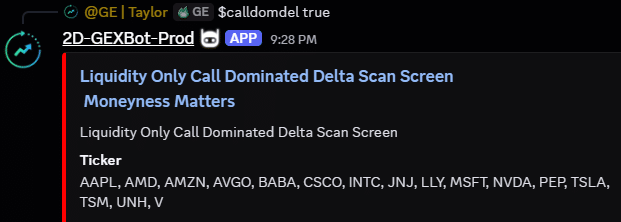
Pro-Tip: Add “true” after any scan command (e.g., $calldomdel true) to isolate results to GammaEdge’s liquidity list—the largest, most liquid names like AAPL, NVDA, TSLA, etc. This focuses your options spread opportunities on stocks with deep options markets.
When the Market Trend Model shows bearish or neutral conditions for options spreads, you run:
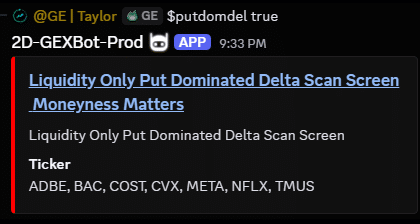
What This Reveals: These scans show you where options positioning favors downside moves. The collective options market is already leaning bearish on these names.
We also have advanced scans like $ptrans2pgex and $zero2ptrans that filter for stocks already positioned near ideal entry or exit levels. Explore these once you’re comfortable with the core scans.
The GammaEdge Advantage: Two clicks. One scan. Strong results. Instead of manually reviewing hundreds of stocks hoping to find options spread opportunities, the scan brings high-probability candidates directly to you based on actual options market positioning.
Here’s the key: these scans don’t replace your technical or fundamental analysis—they enhance it.
If a stock appears in a GammaEdge scan AND aligns with your existing strategy, you’ve identified a high-conviction opportunity:
That’s when you lean in. When all your tools align, you’re not just trading a setup—you’re trading a setup with a structural edge.
You’ve identified the market’s direction (via the Market Trend Model). You’ve found candidates to trade (from the scans). Now comes the most critical decision: where do you place your strikes?
This is where most traders fall apart. They’ve done the hard work of finding a good setup, then they place strikes at round numbers because they “feel right.” Or they sell the 30-delta option because their broker platform says it has a 70% probability of success. Or they just pick strikes near some trendline they drew on a chart.
You’re guessing. And even the best setup fails when strikes are placed poorly.
Without understanding options market structure, strike selection becomes arbitrary:
None of these tell you where the actual options market positioning creates meaningful levels.
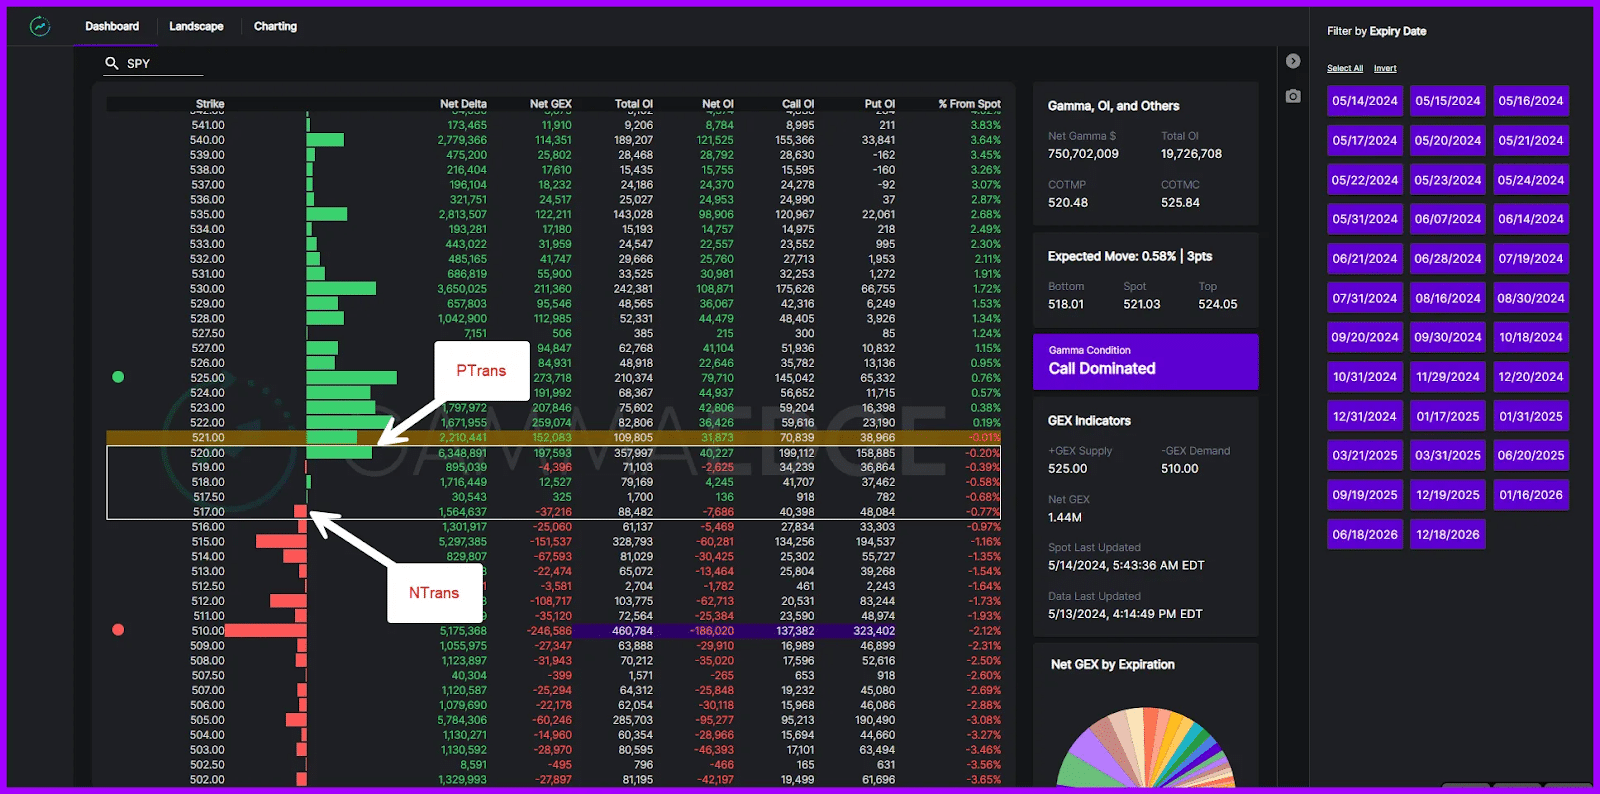
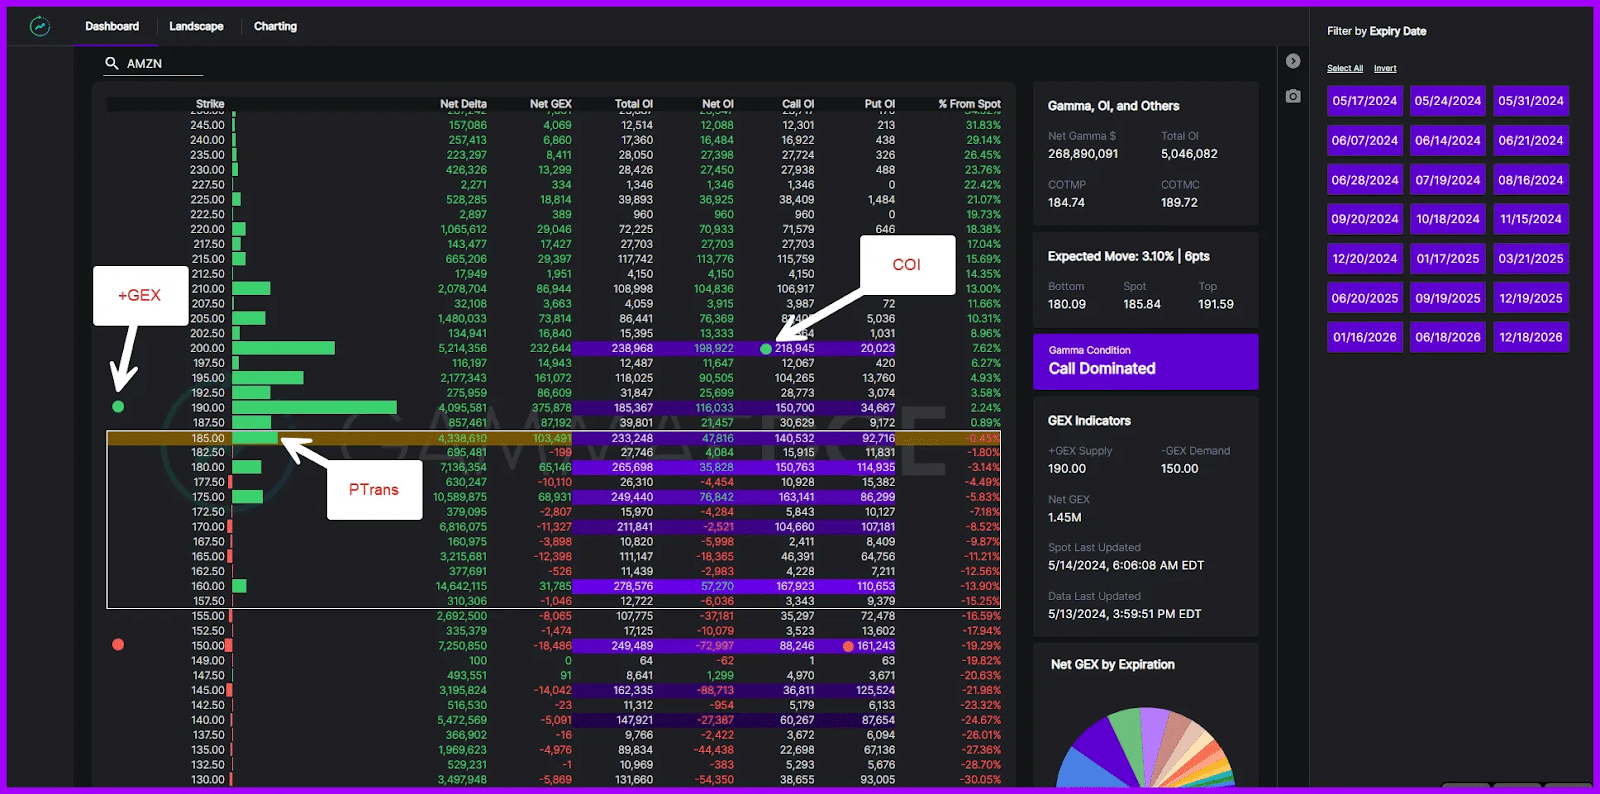
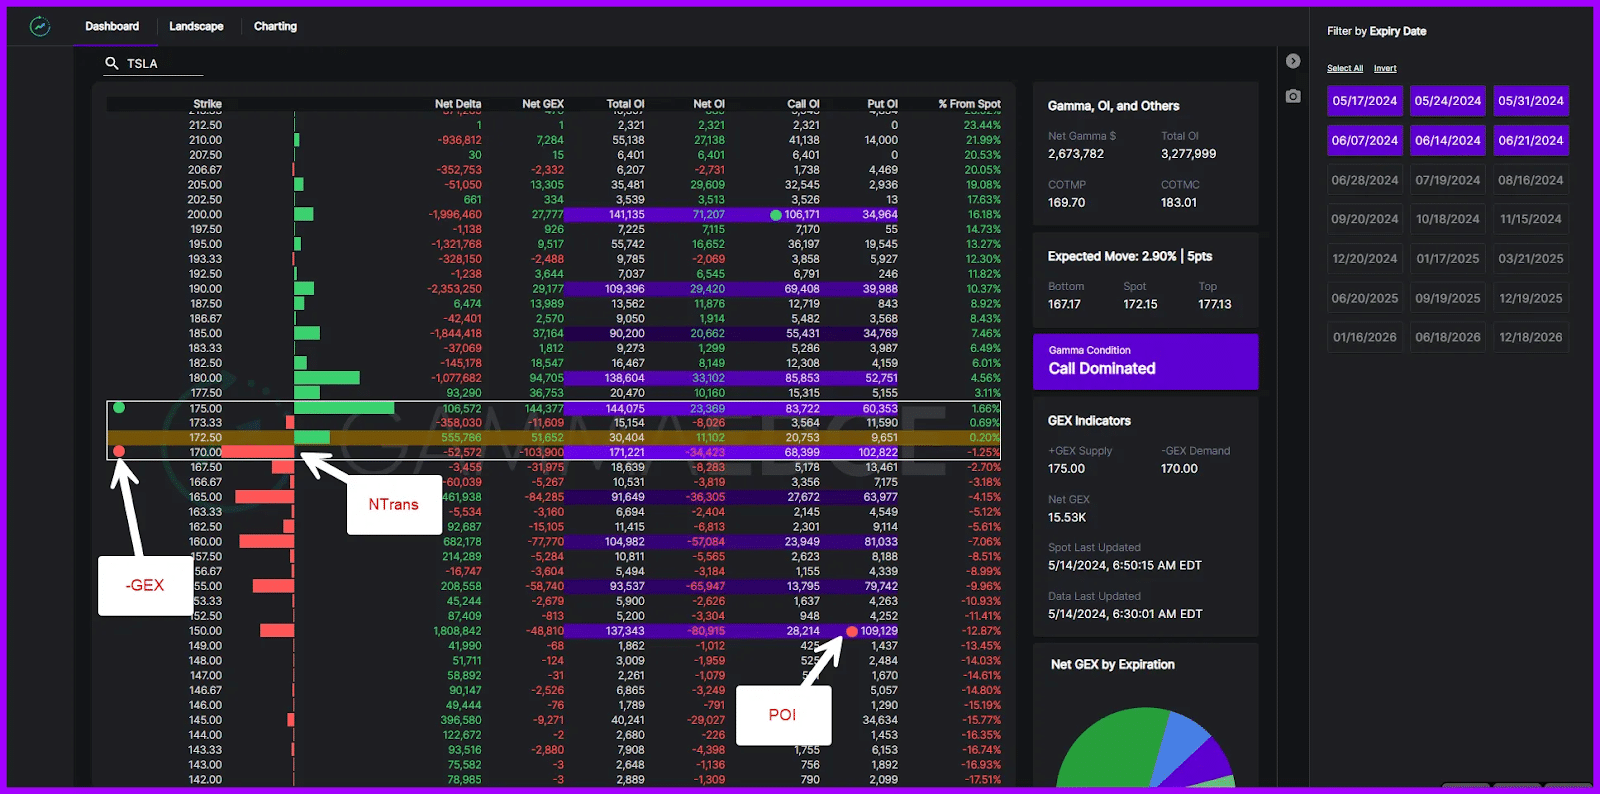
GammaEdge’s levels feature reveals where significant options market activity is concentrated and how that positioning influences price behavior. These aren’t arbitrary—they’re levels derived from actual options positioning that create predictable price dynamics.
Understanding these levels is critical because they don’t all behave the same way:
Let’s break down each type:
When your scan identifies a bullish candidate and TC3+ confirms bullish momentum, here’s what you’re looking for in the levels for your call option spread:
Ideal Bullish Setup Pattern:
Call Debit Spreads (Directional Bet on Upside):
This type of options spread involves:
Put Credit Spreads (Collecting Premium Below Support):
This options spread strategy includes:
When your scan identifies a bearish candidate for options spreads:
Ideal Bearish Setup Pattern:
Put Debit Spreads (Directional Bet on Downside):
This options spread configuration:
Call Credit Spreads (Selling Premium Above Resistance):
This bearish options spread involves:
Here’s what you’re looking for when levels on a scan result pop up for options spread opportunities:
Bullish Spread Example (assuming TC3+ is ON):
Bearish Spread Example (assuming TC3+ is OFF):
Warning Pattern – Avoid This:
The GammaEdge Solution: Spread strike selection becomes systematic. You’re not guessing about your options spread—you’re placing strikes based on actual options market positioning that creates predictable behavior. Buy at acceleration levels, sell into profit-taking zones. Every strike in your options spread has a structural reason for being there.
Once you’ve identified a high-probability setup using GammaEdge’s framework, you have multiple ways to express it beyond just options spreads. The framework identifies WHERE edge exists—how you capture it depends on your risk tolerance, capital allocation, and trading style.
For Bullish Setups (stock above PTrans, targeting +GEX):
For Bearish Setups (stock below NTrans, targeting -GEX):
The power isn’t in dictating HOW you trade—it’s in showing you the opportunities exist and where to place your strikes for options spreads or other strategies based on actual market structure.
Two traders can look at the same GammaEdge setup and execute differently:
Both are using the same structural framework for options spreads. Both are placing strikes at meaningful levels. They’re just matching the expression to their personal style.
Whether you prefer options spreads for their defined risk, stock for simplicity, or options for leverage, GammaEdge shows you:
The rest is up to you.
Your Monday Morning in Action
Let’s walk through what this actually looks like in practice.
8:30 AM – Market Check
You open the Market Trend Model. TC3+ is signaling bullish—the cumulative tick is above the rainbow ribbon and trending higher with a positive slope. You know immediately: you’re hunting for bullish opportunities today.
8:31 AM – Run the Scan
Two clicks. You run the $calldomdel scan. Results populate in seconds:
You focus on the three you know and trade regularly.
8:35 AM – Cross-Reference with Your Analysis
You’ve got two high-conviction candidates: NVDA and AAPL.
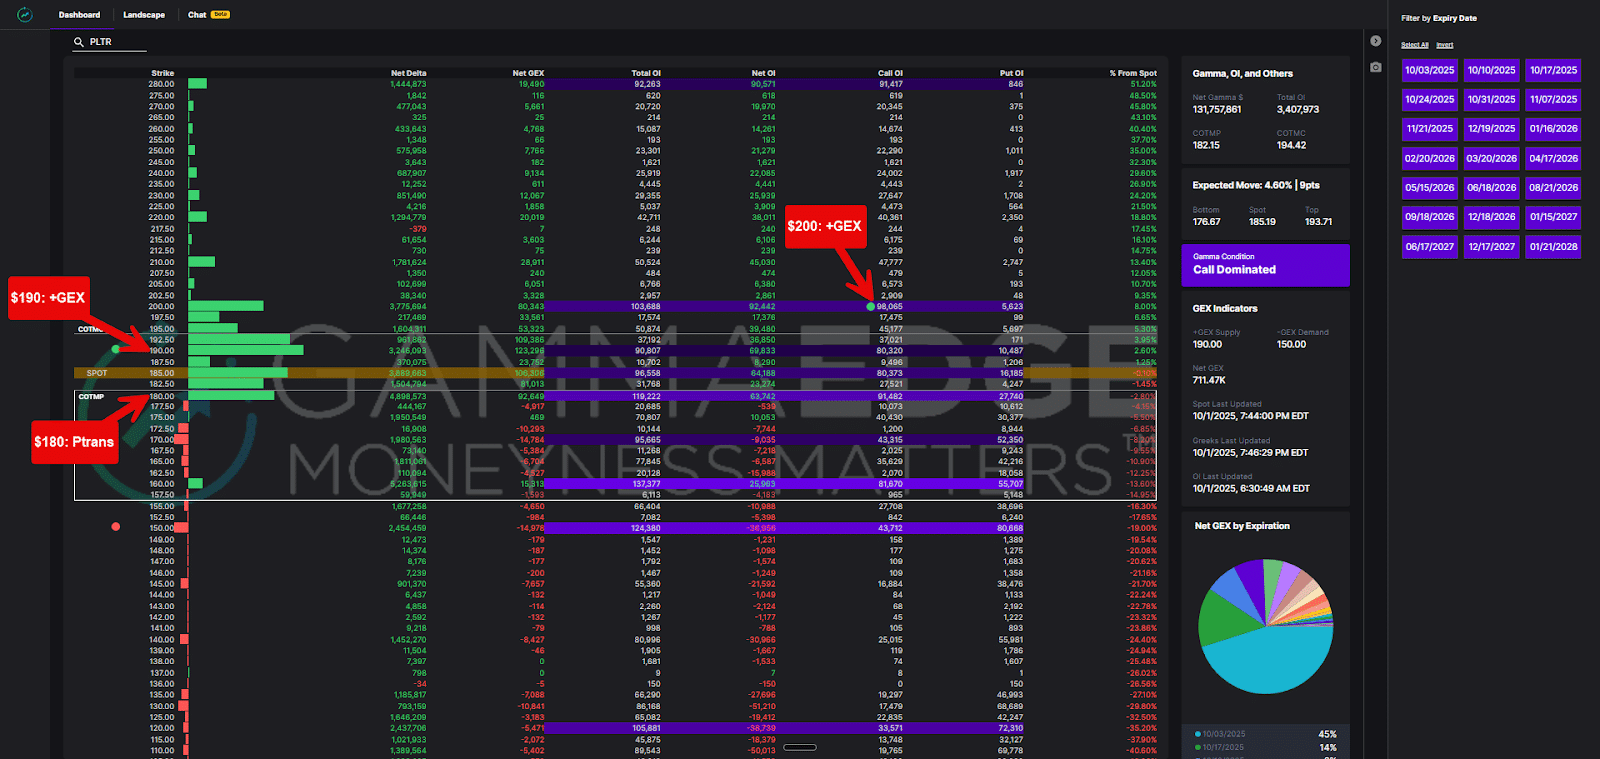
8:37 AM – Check Levels on NVDA
You pull up NVDA’s key levels:
Pattern recognition kicks in: Stock just cleared the acceleration trigger at $187.5. Clean runway to profit-taking zone at $200. If it’s really strong, COI at $210 is your secondary target.
8:39 AM – Structure the Trade
You structure a $187.5/$200 call debit spread:
8:42 AM – Done
Total time: 12 minutes. One high-conviction trade with clear structural edge. Risk defined. Targets set based on where speculators actually take profits.
Now you go about your day. You’re not glued to the screen. You know exactly where +GEX sits ($200), so that’s where you’re watching for profit-taking behavior.
The Contrast
Old Way:
GammaEdge Way:
The Key Insight
You’re not replacing your existing strategy. You’re adding the missing piece—market structure context that shows you:
Your Speed Increases with Practice
First few times? Maybe it takes 20 minutes. After a week? You’ll recognize patterns instantly:
The framework becomes second nature. The patterns jump out at you. You stop guessing and start executing with conviction.
Q: Can I use the GammaEdge Framework if I already have an options spread trading strategy?
Absolutely. This is the most important point: options market structure analysis complements whatever approach you’re already using—technical analysis, fundamental analysis, momentum trading, or any other methodology.
Think of GammaEdge as an additional filter that increases conviction in opportunities you’re already identifying. If you’re a technical trader and you spot a bullish flag pattern, then you check GammaEdge and see TC3+ bullish with the stock appearing on $calldomdel scan and breaking above PTrans—that’s when you lean in heavy. The alignment between your technical view and market structure gives you the confidence to size up.
Q: How is this different from just looking at open interest or unusual options activity for options spreads?
Looking at raw open interest or “unusual activity” alerts gives you isolated data points without context. You might see heavy call buying, but you don’t know:
GammaEdge’s framework puts it all together systematically. You’re not just seeing “big call buying”—you’re seeing that call buying is creating dominance above and below current price (scan), the stock is breaking through an acceleration level (PTrans), and there’s a clear profit target ahead (+GEX). Context transforms data into actionable edge.
Q: Do I need to understand complex options theory?
No. While the analysis behind GammaEdge’s tools is sophisticated, the implementation is straightforward: follow the three-step framework.
The system translates complex market structure into simple signals:
You don’t need to calculate gamma exposure or understand dealer hedging mechanics. The tools show you what matters and where to act.
Q: How often do high-probability opportunities appear?
This depends on market conditions. During strong trending environments with clear TC3+ signals, you might see 10-15 quality candidates daily. During choppy, range-bound markets with no clear TC3+ signal, opportunities are fewer.
The framework helps you recognize when to be aggressive (clear signals, tight structure) and when to be patient (conflicting signals, wide transition zones). Not every day is a trading day, and that’s valuable information in itself.
Q: What if I disagree with the Market Trend Model signal?
Your existing analysis should always be part of the decision. GammaEdge provides market structure context—if it conflicts with your technical or fundamental view, that’s valuable information suggesting either extra caution or passing on the opportunity altogether.
The most powerful setups occur when everything aligns:
When in doubt, wait for better alignment. The framework isn’t about forcing trades—it’s about identifying when edge is clearly on your side.
Q: How reliable is the TC3+ signal?
The TC3+ signal from the Market Trend Model is a core component of several proven GammaEdge strategies, including our 100% mechanical PTrans2PGEX strategy, which has significantly outperformed SPY buy-and-hold. The signal measures actual buying and selling pressure through cumulative tick data—it’s not predictive, but it shows you when momentum is clearly in one direction versus choppy conditions.
Think of TC3+ as your compass. It doesn’t guarantee the market goes higher, but it tells you when conditions favor bullish setups versus when you should be looking elsewhere. Over time, trading aligned with clear momentum signals versus fighting them makes a measurable difference in results.
The Transformation
The difference between random spread trading and systematic opportunity identification comes down to one thing: market structure awareness.
GammaEdge’s three-step framework eliminates the guesswork. The Market Trend Model shows you directional momentum through actual transaction flow. Scans surface stocks where options positioning creates edge. Key levels reveal exactly where to place strikes based on acceleration zones and profit-taking levels.
This isn’t about replacing your existing strategy—it’s about adding the critical layer most traders are missing. You’re seeing where collective market participants are positioned and how that positioning influences price action.
Why This Works
These aren’t theoretical levels drawn on a chart. PTrans and NTrans show you where options positioning creates acceleration. +GEX and -GEX show you where speculators take profits. COI and POI reveal extended targets in trending markets.
When you know a stock just broke through PTrans with call dominance building and +GEX sitting at a clear level overhead, you’re not hoping it works—you understand why it has edge. You’re aligned with market structure instead of fighting it.
Your Next Steps
This way of thinking about options market structure may be entirely new for you. That’s precisely why we created the GammaEdge FastPass—our flagship educational course designed to accelerate your learning curve significantly.
As with all our education, it’s completely free and provides you with everything a paid member of our community receives. That includes our complete methodologies, proven strategies, systematic frameworks, and institutional-level tools. We hold nothing back.
The Opportunity
While other traders are drawing trendlines and hoping for breakouts, you’ll be reading the structural forces that actually drive price action. You’ll know which moves have positioning support and which are likely to fail.
The opportunities are there every day. GammaEdge simply shows you where to find them systematically.
The framework is complete. The process takes minutes. All that’s left is implementation.
Until next time,
Taylor
GammaEdge Co-Founder