%201.avif)

GEX Ratio Trading Strategy: How to Predict Market Reversals Before Price Action
.png)
Taylor Drake
.png)
December 12,2025
.png)
15mins read
Have you ever seen a stock rise day after day, only to suddenly reverse course with no apparent warning? Or perhaps you’ve hesitated to enter what looked like a strong uptrend, only to miss a significant move because you weren’t confident in its staying power?
The challenge most traders face isn’t seeing what’s happening right now—it’s anticipating what will happen next. Traditional tools like price patterns and technical indicators can only tell you where the market has been, not where it’s headed.
What if you could see sentiment shifts before they appear on price charts? That’s exactly what the GEX Ratio provides.
This simple yet powerful tool measures the balance between call and put activity in the options market, giving you a window into how market participants are positioning themselves. More importantly, it often signals major sentiment shifts days or weeks before price confirms the move.
With the GEX Ratio, you can:
If you’d rather watch a video breakdown of today’s content, here you go:
The GEX Ratio (GR) is a straightforward market sentiment indicator that measures the balance of options positioning. The calculation is refreshingly simple:
GR = Total Call Gamma ÷ Total Put Gamma
This single measurement tells you whether calls (upside bets) or puts (downside bets) are dominant in the market structure:
Pro Tip: Individual stocks typically maintain GEX Ratios above 1.0 since retail traders naturally prefer upside speculation in single names. Because of this, what's most valuable is tracking both the absolute value and the trend.
The GR solves a fundamental problem with traditional sentiment indicators like the standard Put/Call ratio—it naturally incorporates the crucial element of time.
Consider this scenario: A trader buys 40,000 put contracts expiring a year from now. This immediately skews the traditional Put/Call ratio toward bearish sentiment. But does this position impact today’s market? Not meaningfully.
By using gamma rather than simply just volume, the GEX Ratio naturally emphasizes what matters most:
This time-weighted approach delivers three key benefits:
To leverage this indicator effectively, follow this four-step approach:
Each instrument has its typical range—what’s high for one may be average for another:
What matters is where the current reading sits within that specific stock’s history.
The ratio’s movement often tells you more than its absolute value:
The GEX Ratio frequently leads price movement:
Use the GR as a confirmation tool for your trading bias:
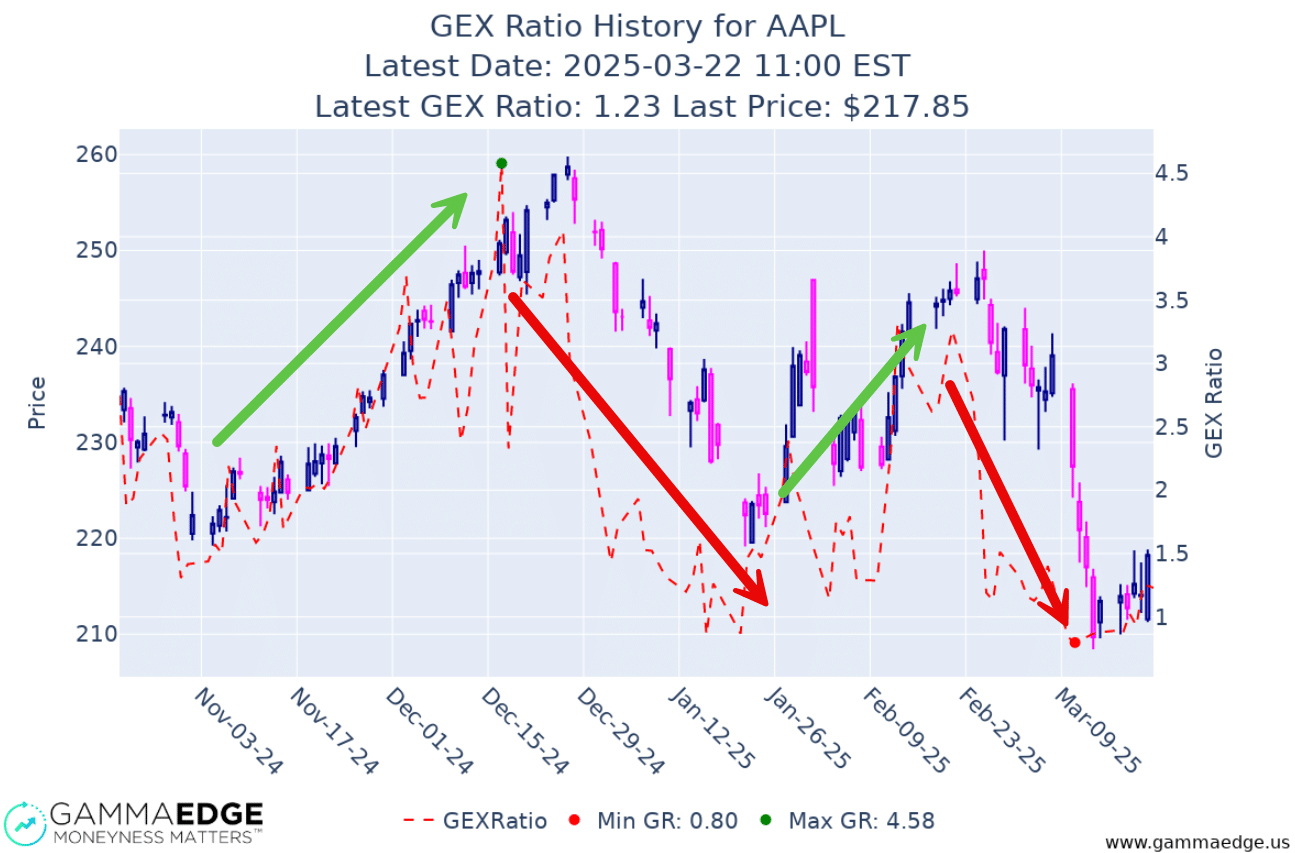
Looking at AAPL’s GEX Ratio history reveals valuable data:
What’s particularly interesting is how closely price followed these structural shifts. The December/January deterioration (as well as the February 2025 decline) in GR preceded and accompanied significant price weakness – precisely what we want to spot early.
Note how the GR peaked two weeks before the spot price reached its high. By the time the price reached its high, the GEX Ratio had already started to decline, telling you the market was positioning for less upside/greater downside as call speculation weakened.
This pattern repeated in mid-February 2025. The price bounced from the January 2025 lows, but the GEX Ratio again sharply fell ahead of the eventual price decline throughout February and into March 2025.
Pro Tip: Notice that AAPL's GEX Ratio typically fluctuates between 1.5 and 3.5, with extremes at 0.75 and 4.6. When the ratio approaches the upper end of this range (as it did in December 2024), it often signals potential overextension of bullish sentiment. Conversely, it may indicate oversold conditions when it nears the lower boundary. Always evaluate the ratio relative to the stock's historical range rather than using fixed values.
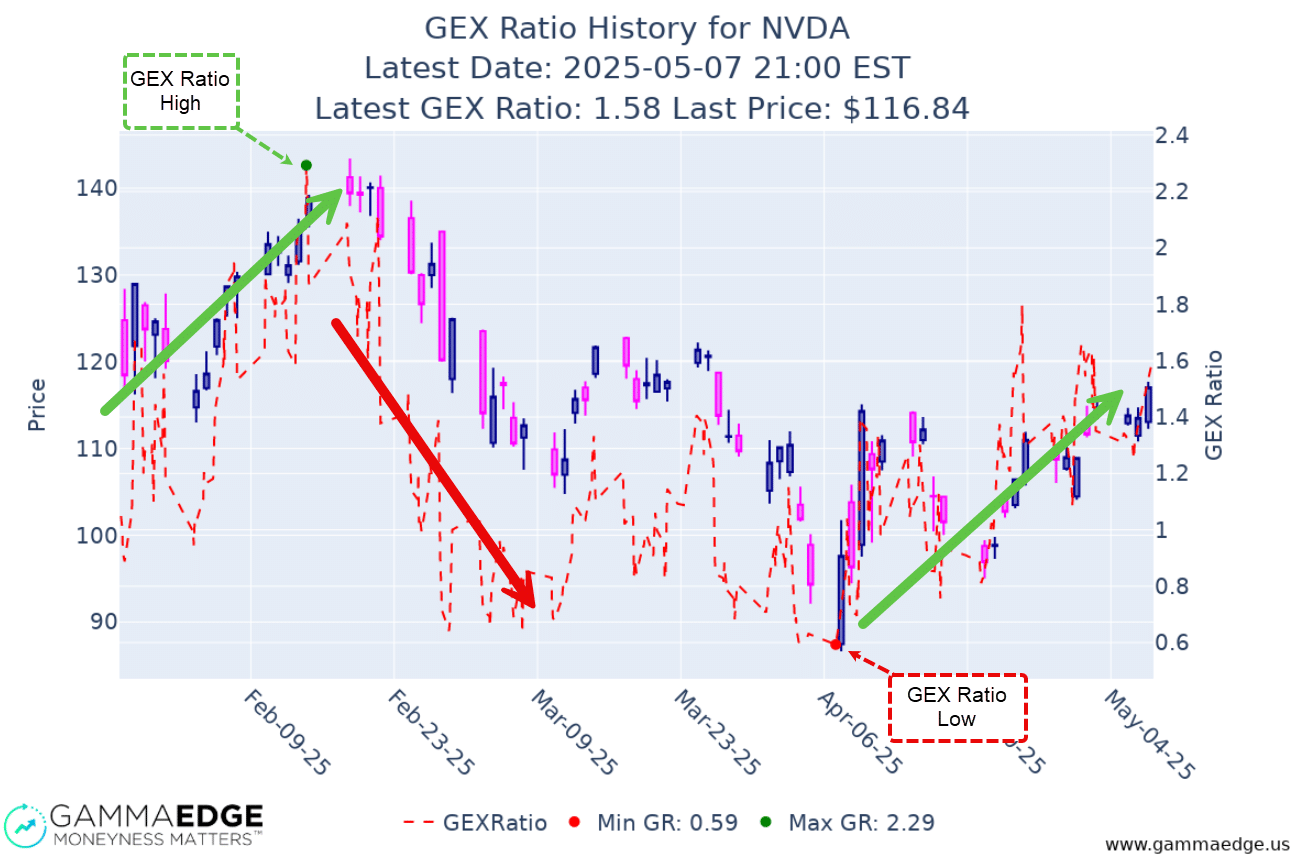
NVDA’s price action alongside its GEX Ratio from February through May 2025 demonstrates how the GEX Ratio can serve as both a confirmation tool and an early warning system.
Key observations:
Pro Tip: NVDA demonstrates how different stocks maintain different characteristic ranges for its GR. While AAPL often exceeds 2.0 when sentiment is bullish, NVDA's ratio tends to top out near 2.0. This reinforces why understanding each stock's typical range is crucial for effective analysis.
Once you understand what the GR tells you, it’s time to put this knowledge to work in your daily trading routine.
The GEX Ratio helps you establish a clear directional bias before the market opens:
For example, if several major tech stocks show declining GRs while their prices continue to climb, this collective warning sign might suggest caution across the entire sector.
The GEX Ratio can significantly improve your entry and exit timing:
For long entries:
For managing long positions:
For short considerations:
The GR becomes significantly more powerful when paired with other market structure tools:
With Delta Balance:
With Trend Analysis:
Each stock has its own “normal” range – what’s high for one may be average for another.
The direction of change often matters more than the current reading.
The GEX Ratio is most valuable when confirmed by other tools
The ratio can lead price changes by days or even weeks – patience is essential
To get the most from the GEX Ratio, incorporate these simple steps into your trading day:
This simple process helps ensure you’re always trading with, rather than against, the market’s underlying sentiment.
The GEX Ratio offers a unique window into market sentiment that traditional indicators simply can’t provide. By measuring the balance between call and put gamma, it reveals not just the current sentiment but where that sentiment is headed, often before price confirms the move.
With the GEX Ratio in your toolkit, you can:
Remember, the magic is in tracking both the value and the trend. By making the GEX Ratio part of your daily routine, you’ll position yourself on the right side of market sentiment rather than fighting against it.
Ready to take your trading to the next level with advanced market structure analysis? Join thousands of traders in our free newsletter where we break down these concepts weekly with real market examples.
Note: The examples shown in this article are from past dates and don’t reflect current market conditions. Be sure to run your own analysis to get the most up-to-date and accurate information for your trading decisions.