%201.avif)

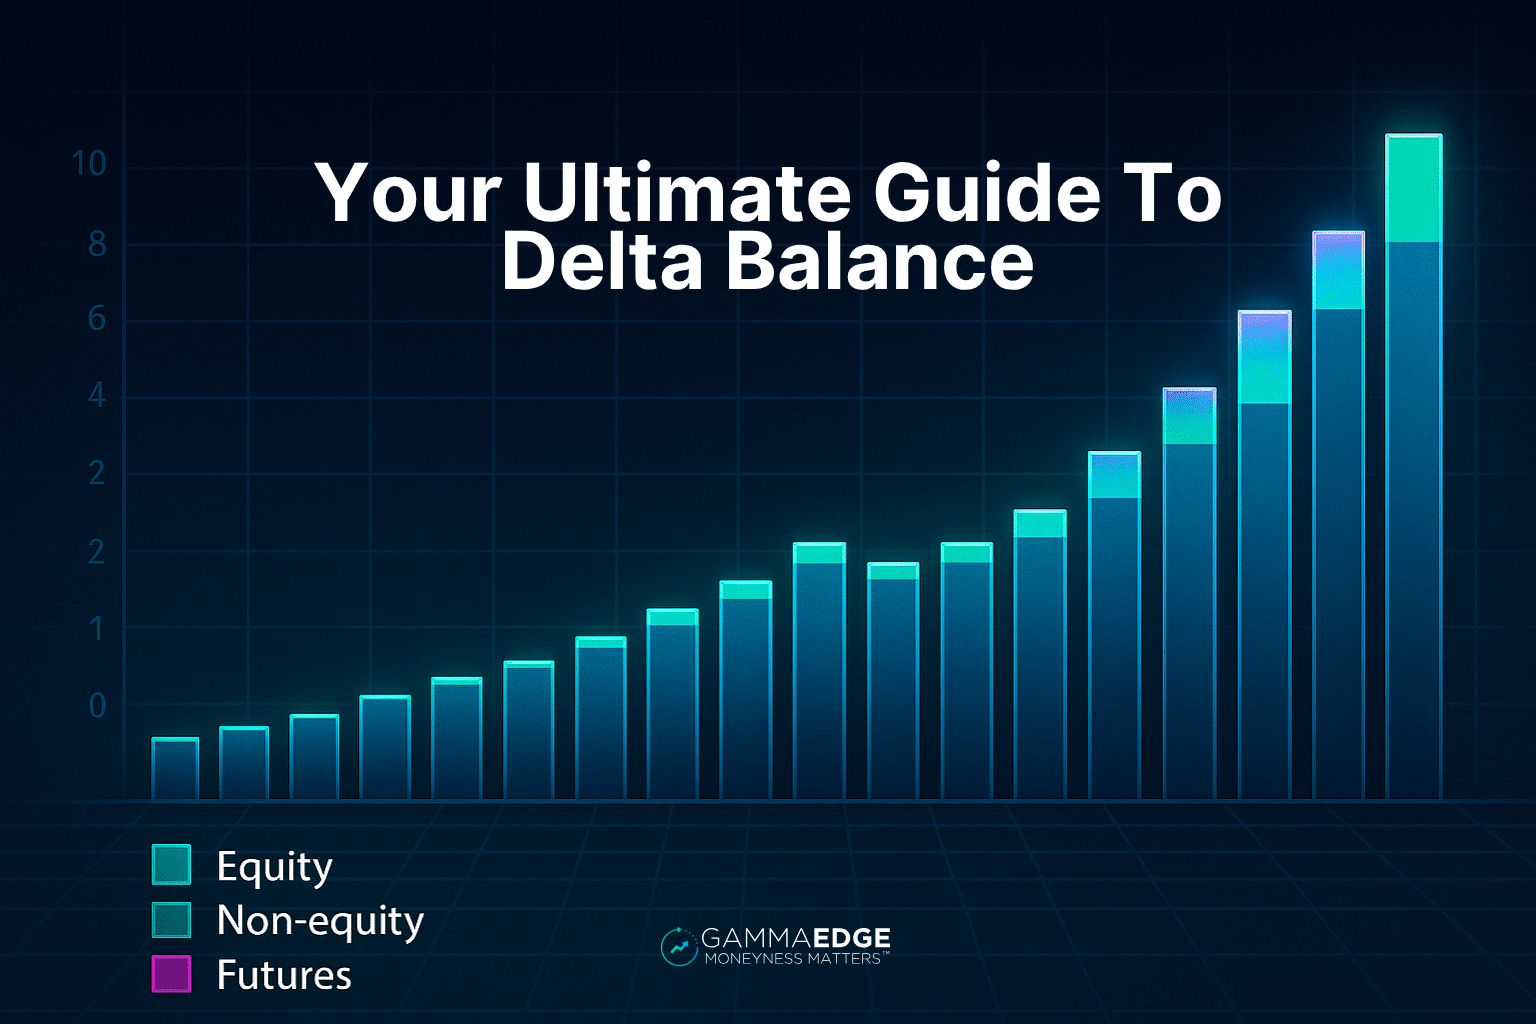
Delta Balance In Trading: Your Ultimate Guide To Reading Market Structure Like A Pro
.png)
Taylor Drake
.png)
December 12,2025
.png)
15mins read
The options market has grown 5x in just the last three years. SPX zero-days-to-expiration (0DTE) options alone now make up over 50% of all SPX options trading, with over $1 trillion in notional value changing hands daily.
This explosive growth means options positioning often drives stock prices rather than the other way around – the tail is now wagging the dog. Understanding how all these participants are positioned has become critical for anyone trading today’s markets.
What makes options markets particularly valuable is that they’re inherently forward-looking. While price charts only show you what has already happened, options reveal where speculators expect prices to be in the future – across various time horizons.
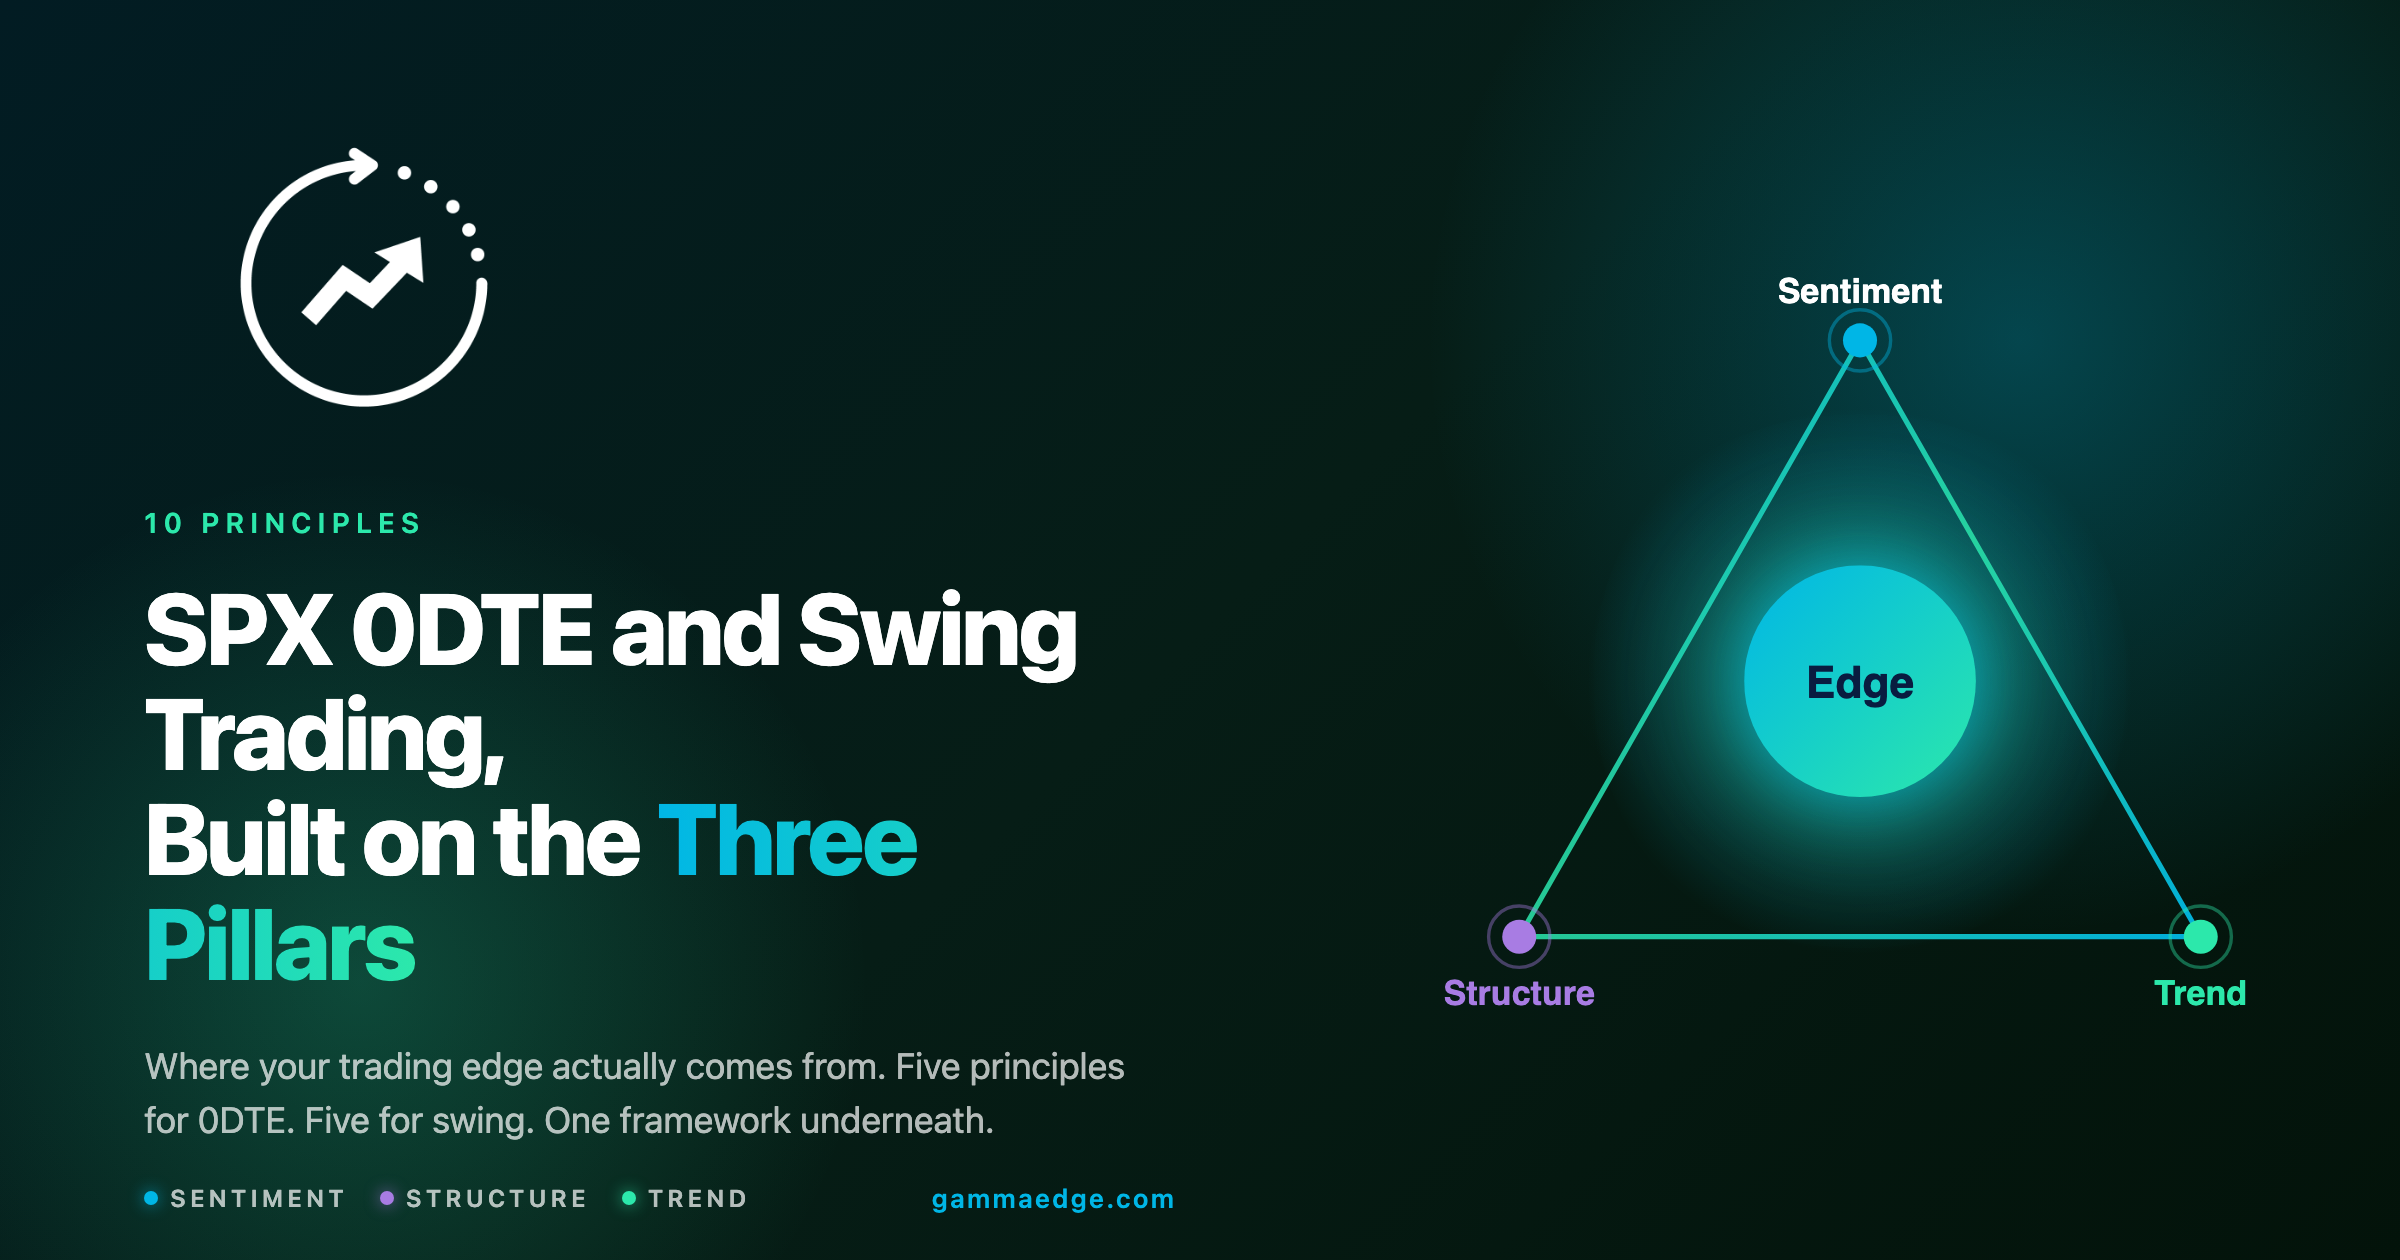
Delta balance in trading represents one of the most powerful tools for understanding this forward-looking market structure. By mastering delta balance analysis, you can see market expectations across different time horizons and position yourself ahead of major moves.
Delta balance in trading is a sophisticated tool that visualizes the ongoing battle between call and put speculators above and below the current market price. Think of it as a real-time map showing where bulls and bears are placing their bets across the entire options structure.
The Delta Balance tool reveals three critical components:
This forward-looking aspect matters because markets are path-dependent. Today’s positioning influences tomorrow’s price movement, which then shapes the next day’s action. By understanding how speculators are positioned not just now but across different future expirations, you can see the expected “roadmap” from point A to point B to point C.
Traditional trading delta balance analysis goes far beyond simple price charts. While conventional technical analysis focuses solely on historical price patterns, delta balance in trading reveals the actual positioning of market participants who are betting on future outcomes.
Here’s the key distinction:
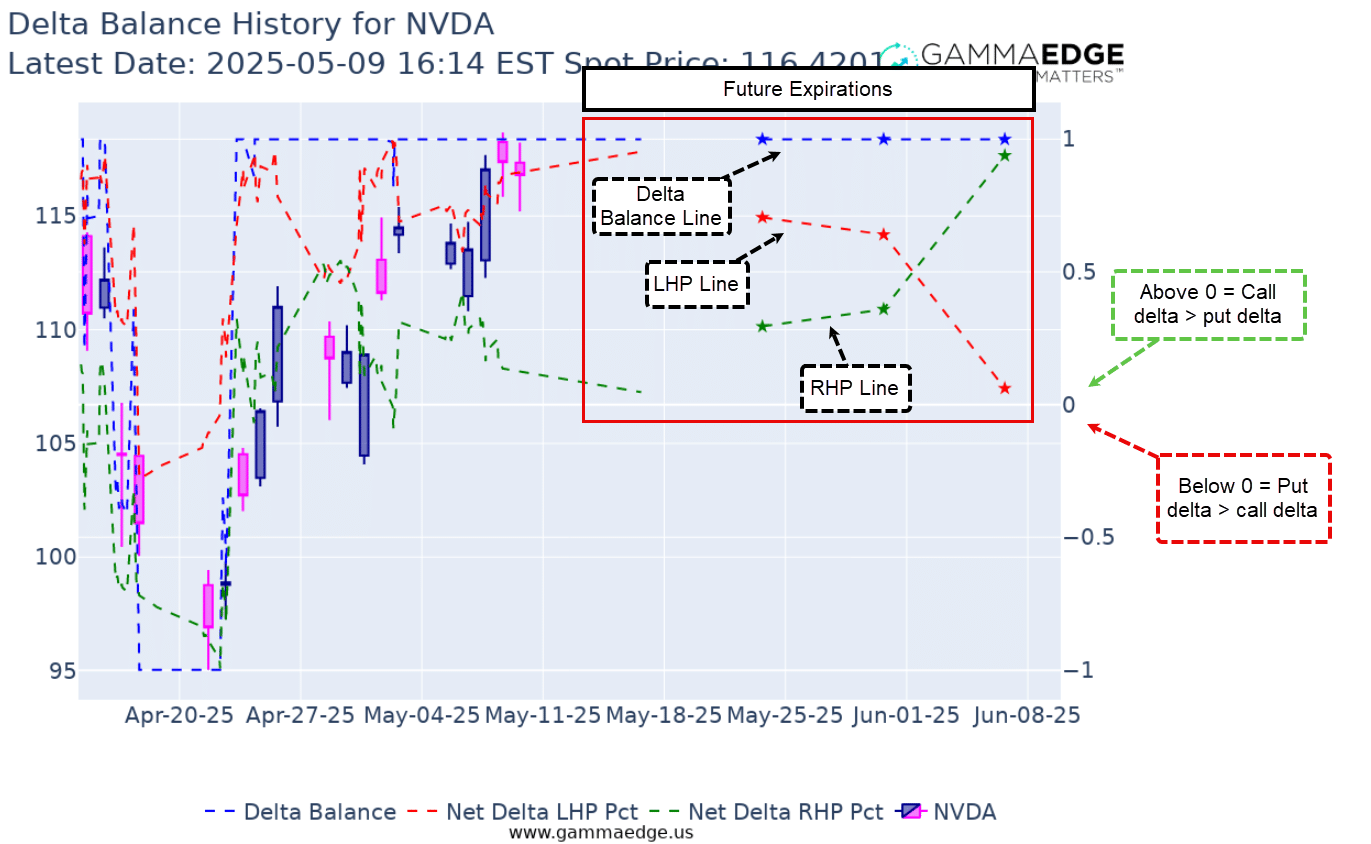
The delta balance chart visualization produces three key trend lines that tell the complete story of market structure:
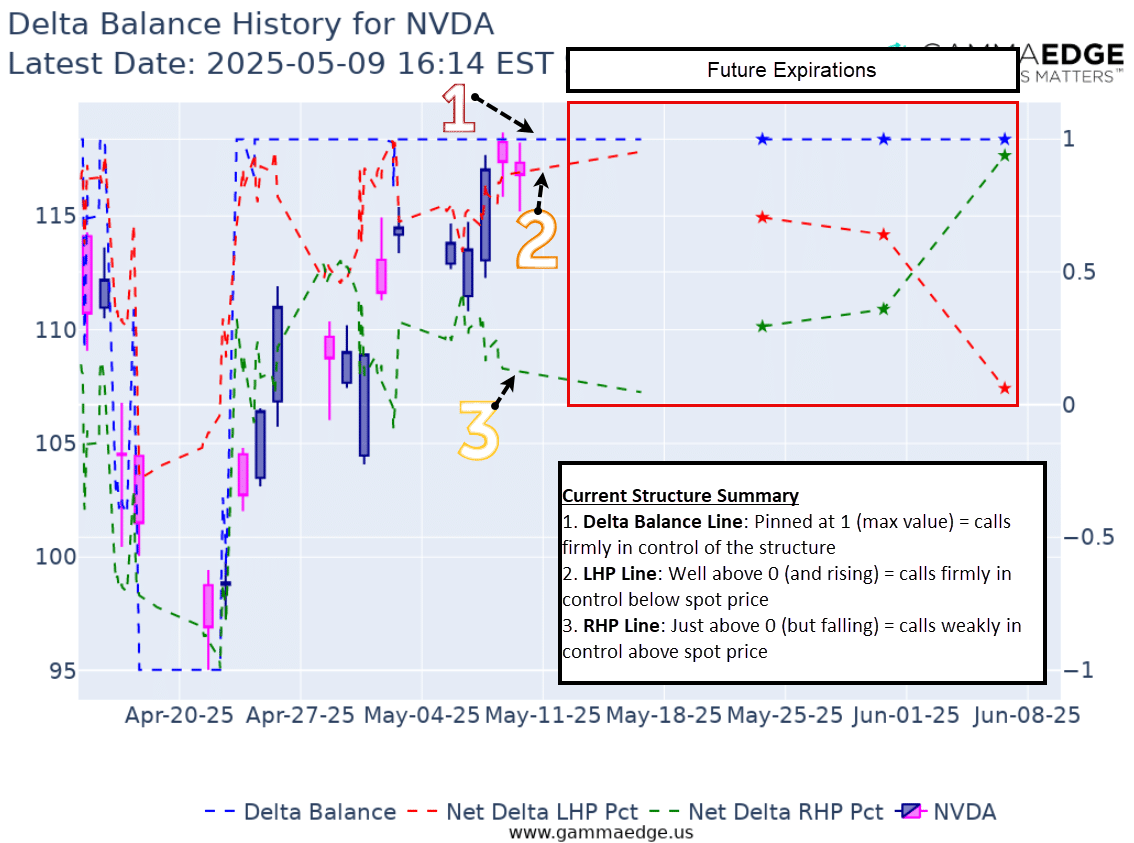
The red box on the right side of the visualization shows future expirations – your window into the market’s future expectations. When future expirations show a different picture than current positioning, it can be an early warning of a sentiment shift before it appears in price.
Pro Tip: The trend of the delta balance lines often tells a more important story than their absolute values. Rising lines indicate strengthening call positioning (bullish momentum building), while falling lines show increasing put dominance (bearish pressure growing).
Delta balance trading strategies provide three key advantages over traditional analysis:
Reveals whether bullish or bearish positioning is dominant above and below current price, giving you a complete picture of market structure.
Often shows sentiment shifts before they appear in price action, allowing you to position ahead of major moves rather than chasing them.
The plotting of delta balance for future expirations visualizes the future expectations of speculators regarding price appreciation or depreciation.
Right Hand Plane Analysis (Above Spot Price):
Left Hand Plane Analysis (Below Spot Price):
Overall Delta Balance:
Bullish Structure in Delta Balance Trading:
Bearish Structure in Delta Balance Trading:
The true value of delta balance analysis in trading comes from watching how structures evolve over time:
Strengthening Bullish Trend:
Deteriorating Bullish Trend:
Unlike traditional sentiment tools that simply measure overall put/call ratios, volume, or just things only through a price chart, Delta Balance specifically shows where sentiment is concentrated in the market structure. It reveals not just whether bulls or bears are dominant, but exactly where they’re placing their bets relative to current price – both now and in future expirations.
Delta Balance isn’t designed to predict specific price targets. Rather, it shows you the structural forces that influence price movement. Think of it as revealing the path of least resistance rather than an exact destination. When used alongside other GammaEdge tools like the Market Trend Model, it helps you understand the “why” behind price movement.
The Delta Balance tool is particularly valuable for multi-day and multi-week trades – its true power lies in showing structural shifts across different time horizons. Swing traders often find the most value by monitoring changes in future expirations for early signals of trend changes.
Delta Balance works powerfully alongside other GammaEdge tools:
The greatest unlocks often come from finding confluence between these different tools – when they all point in the same direction, your conviction in a trade increases significantly.
In fact, we wrote a specific deep dive on using the Delta Balance tool in tandem with the GEX Ratio, which you can unlock HERE.
Delta balance trading becomes even more powerful when combined with complementary analysis tools:
Delta balance in trading offers a unique window into market structure that price charts alone simply cannot provide. By revealing the positioning of call and put speculators across different timeframes, you gain insight into not just current sentiment, but where the market expects to go next.
What makes delta balance trading particularly powerful is its forward-looking nature. The visualization of future expirations often signals trend changes days or even weeks before they appear in price action – giving you a crucial edge in positioning ahead of major moves rather than chasing them after they’ve begun.
Through this comprehensive guide, you’ve learned how to:
Remember that delta balance in trading is most effective when used as part of your broader analysis framework. When combined with other tools like the GEX Ratio and Market Trend Model, you create a comprehensive view of market conditions that can significantly improve your trading decisions.
Start by monitoring delta balance for major indices and a few key stocks in your watchlist. Pay particular attention to any divergences between current positioning and future expirations, as these often provide the earliest signals of important market turns.